
Overview
Top 3 Analysen
1. Wie läuft es gerade und welche Kategorien sollte ich mir genauer anschauen?
2. Welche Suchbegriffe sollten in den ASIN Content?
3. Auf welchen generischen Suchbegriffe sollte ich jetzt Werbung schalten?
Alle Zahlen und Screenshots in diesem Guides stammen aus echten Beispiel-Abfragen für die Marke Samsung im Juni 2026 und dienen nur der Illustration des Vorgehens.
Step-by-Step-Guide Beispiel 1
1. Wie läuft es gerade und welche Kategorien sollte ich mir genauer anschauen?
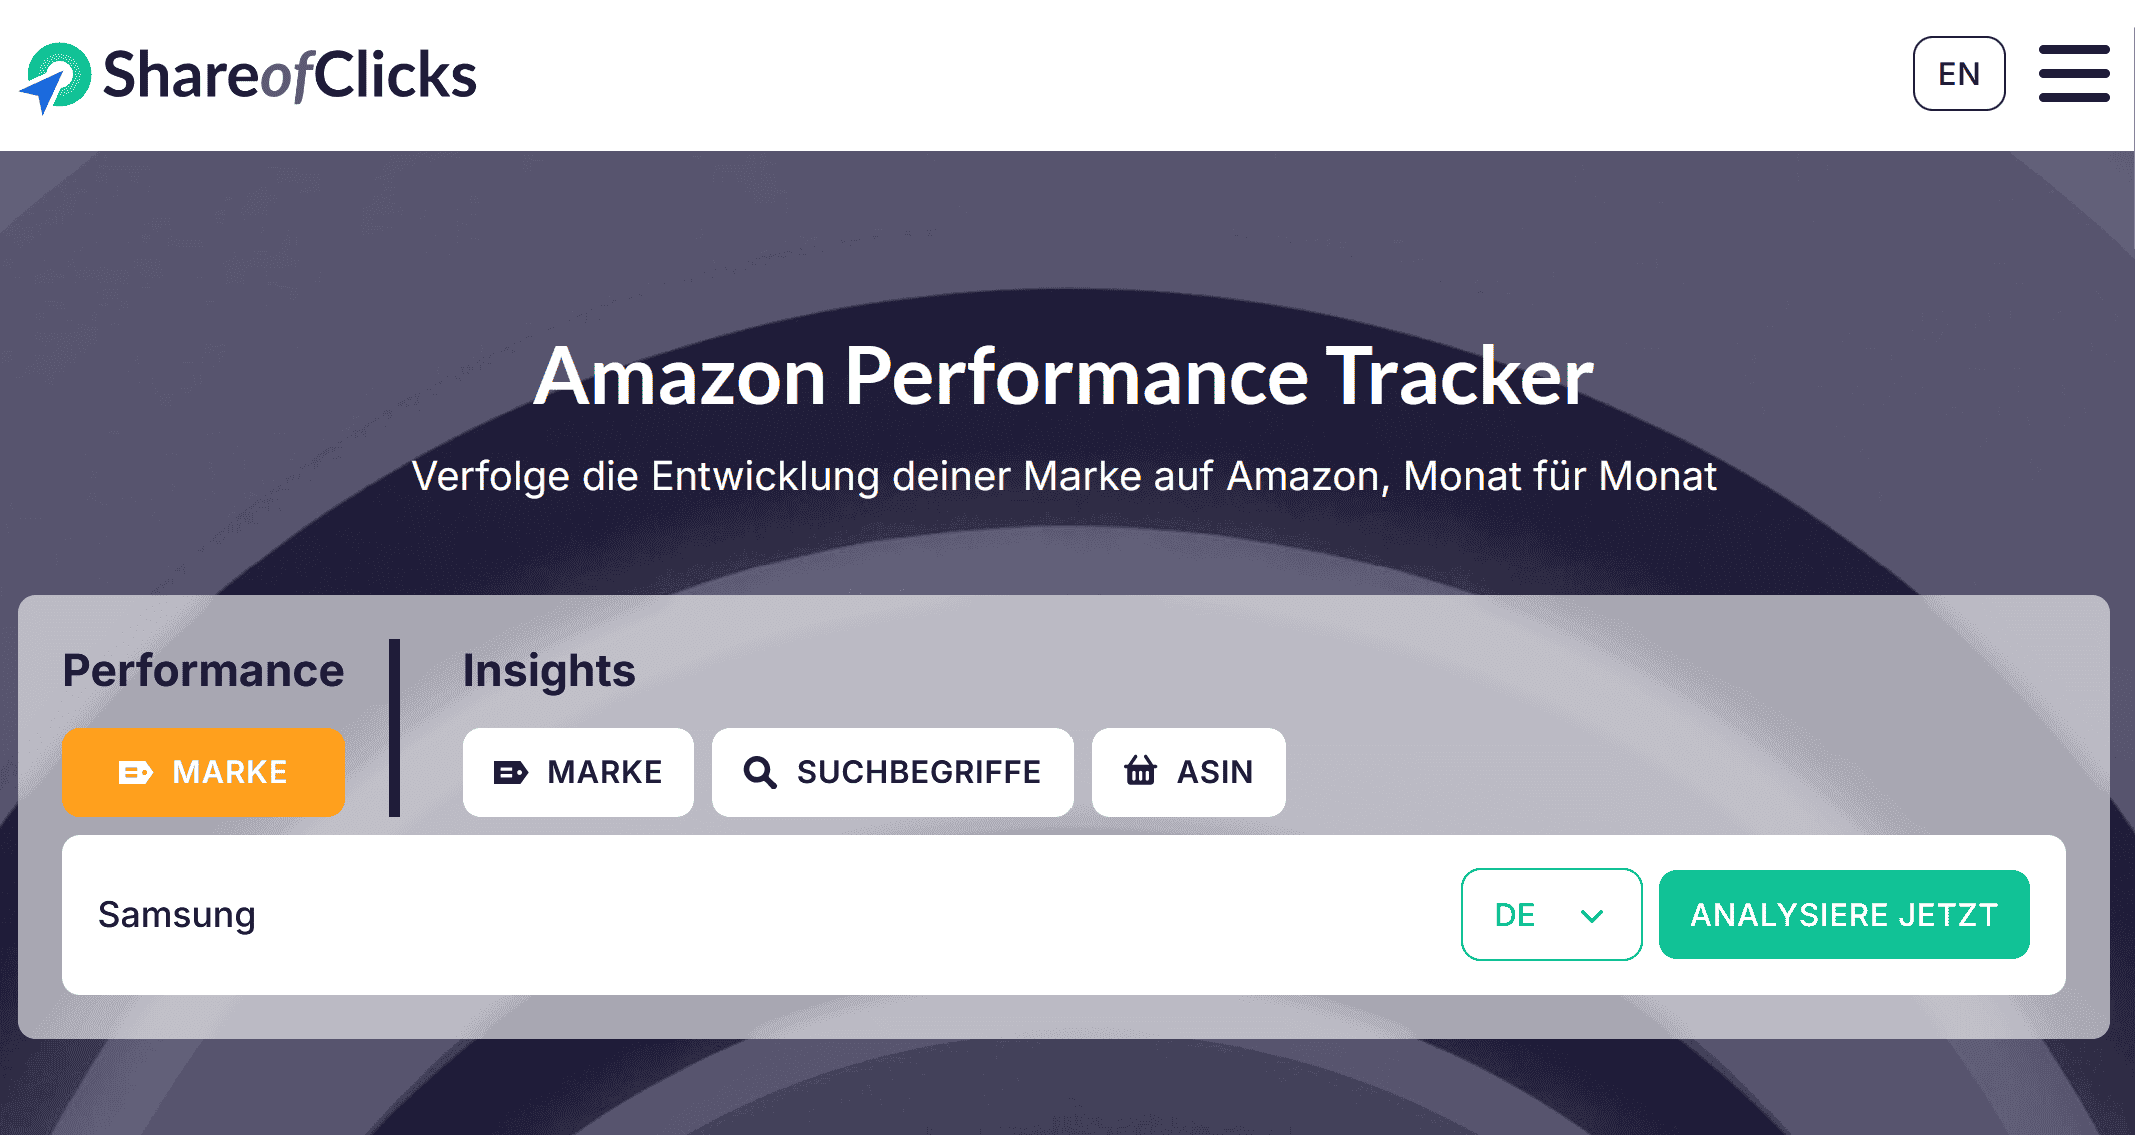
I. Auswahl und Eingabe auf Landing Page
- Klick auf den Button "Performance-Marke".
- Wähle den Marktplatz aus (Beispiel: DE).
- Gib die gewünschte Marke ein (Beispiel: Samsung).
- Klick auf "Analysiere jetzt".
II. Übersichtsseite liefert erste Hinweise
Ansatz:
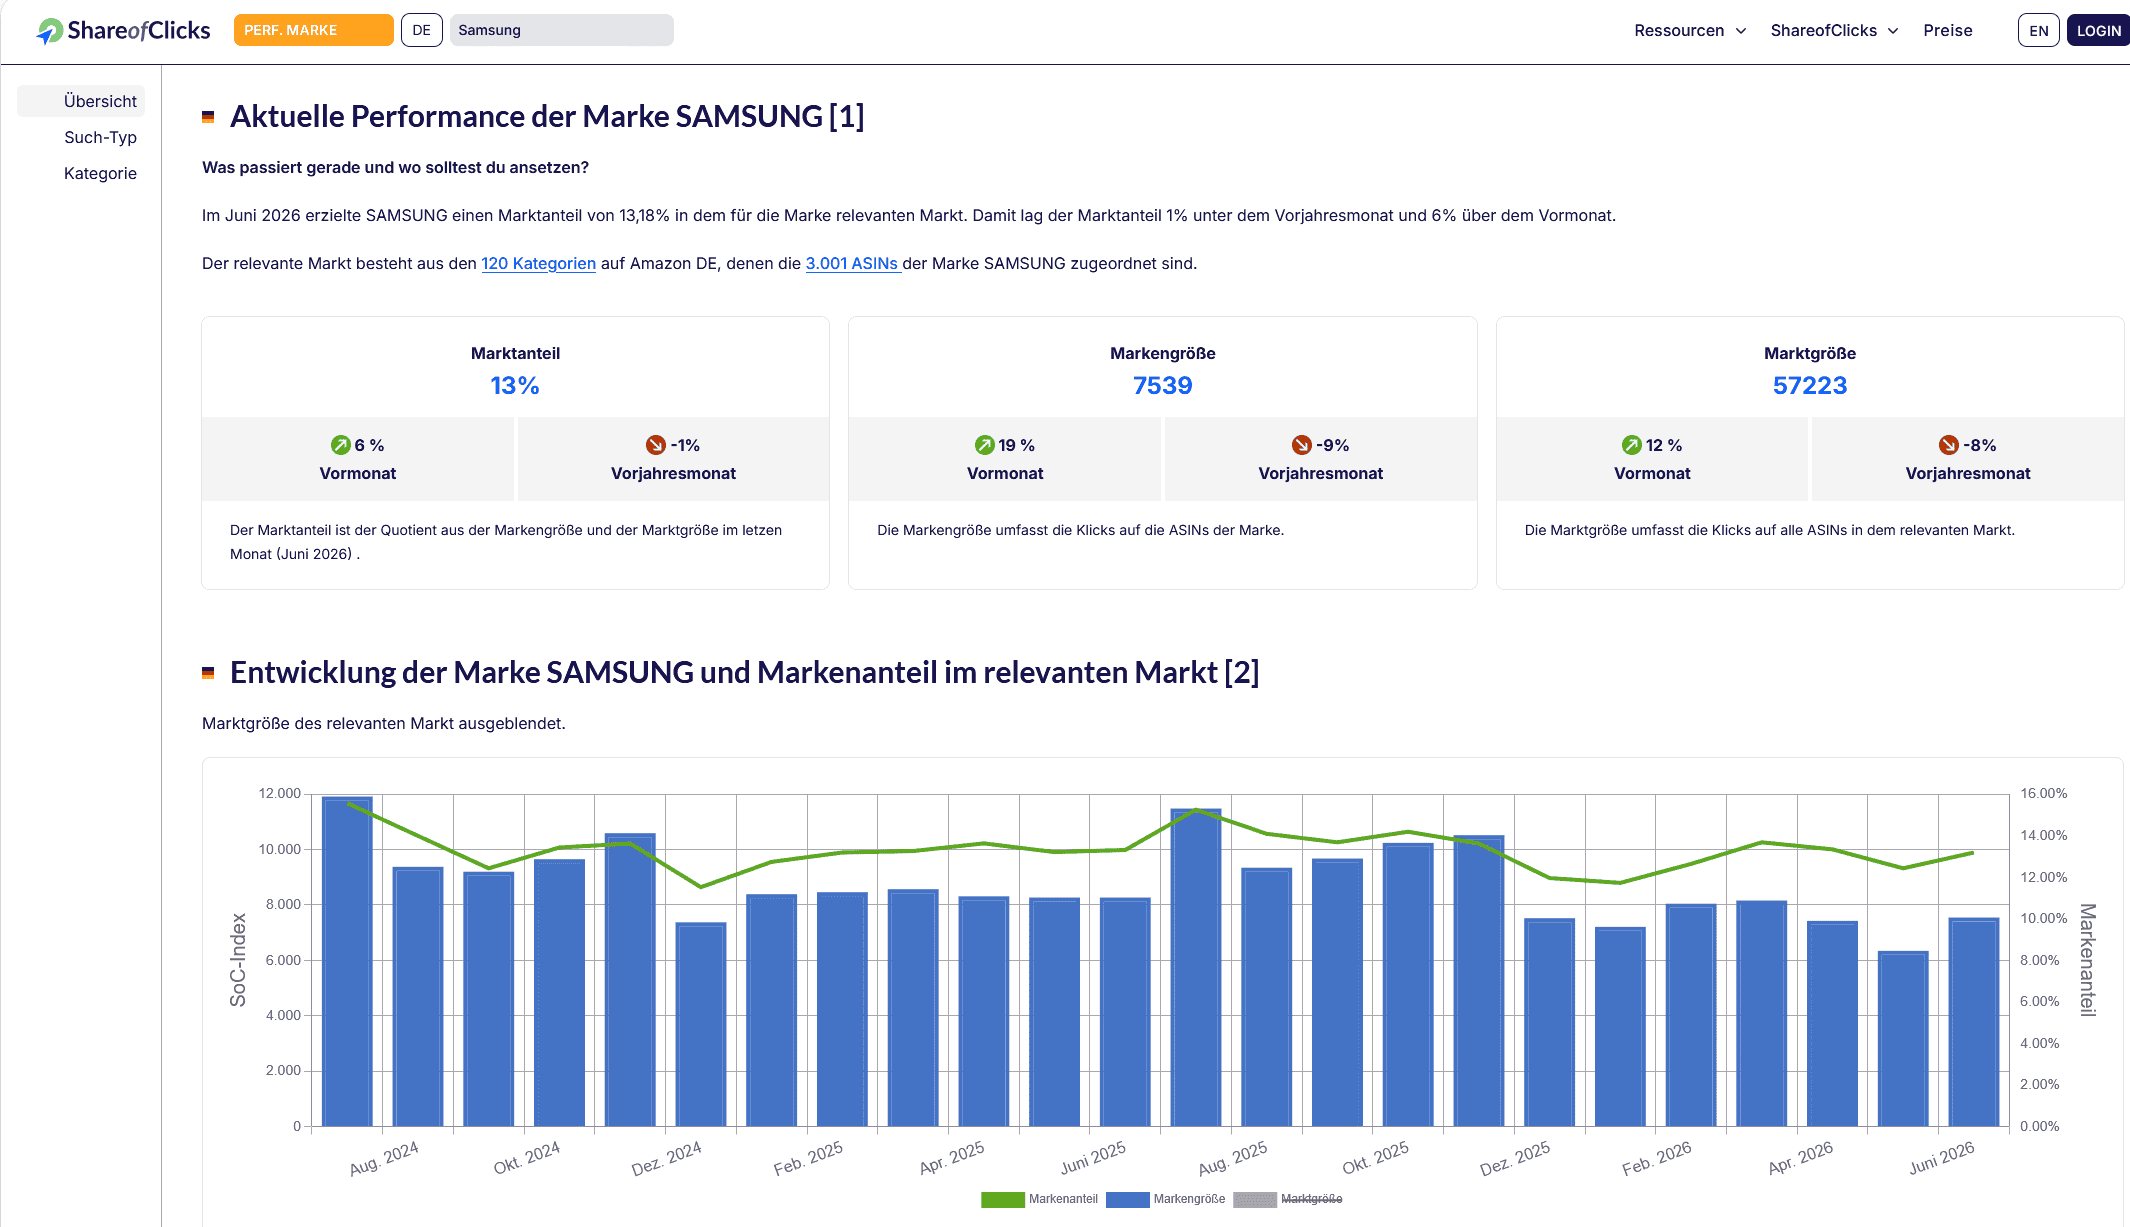
- Tabelle (1) zeigt Marktanteil, Markengröße und Marktgröße der Marke im relevanten Markt – jeweils im Vergleich zum Vormonat und zum Vorjahresmonat.
Beispiel-Interpretation:
- Der SoC-Anteil von Samsung am relevanten Markt (120 Kategorien) liegt bei 13,18 % – damit 6 % über dem Vormonat und 1 % unter dem Vorjahresmonat.
- Im Monatsvergleich wuchsen sowohl Samsung (Markengröße +19 %) als auch der relevante Markt (Marktgröße +12 %), wobei Samsung Marktanteile gewann. Im Jahresvergleich schrumpften dagegen sowohl Samsung (–9 %) als auch der relevante Markt (–8 %).
III. Review Gewinner Kategorien
Ansatz:
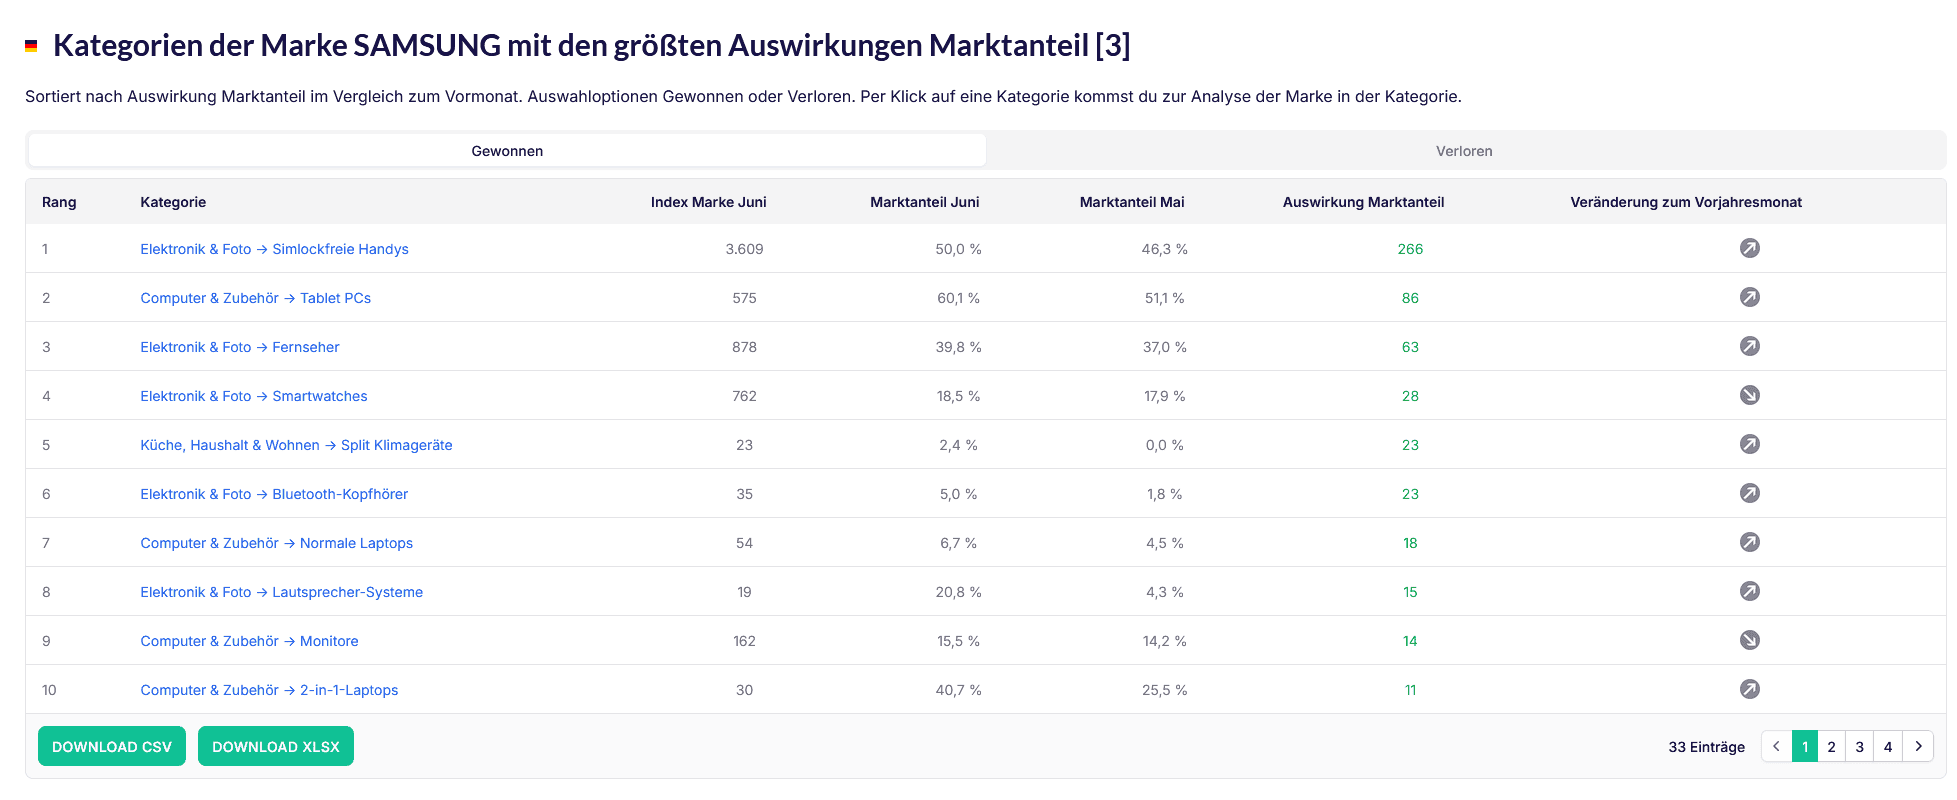
- Wähle oben in Tabelle (3) "Gewonnen" aus.
- Gewinner-Kategorien sind Kategorien, in denen die Marke im Vergleich zum Vormonat Anteile gewonnen hat und sich besser entwickelt hat als die Kategorie insgesamt.
- Ein Klick auf eine Kategorie führt zur Analyse der Marken-Anteile in der ausgewählten Kategorie.
Beispiel-Interpretation:
- Größter Gewinner, die Kategorie „Simlockfreie Handys“ mit einem Marktanteils-Zuwachs von 46,3 % auf 50,0 %.
IV. Review Verlierer Kategorien
Ansatz:
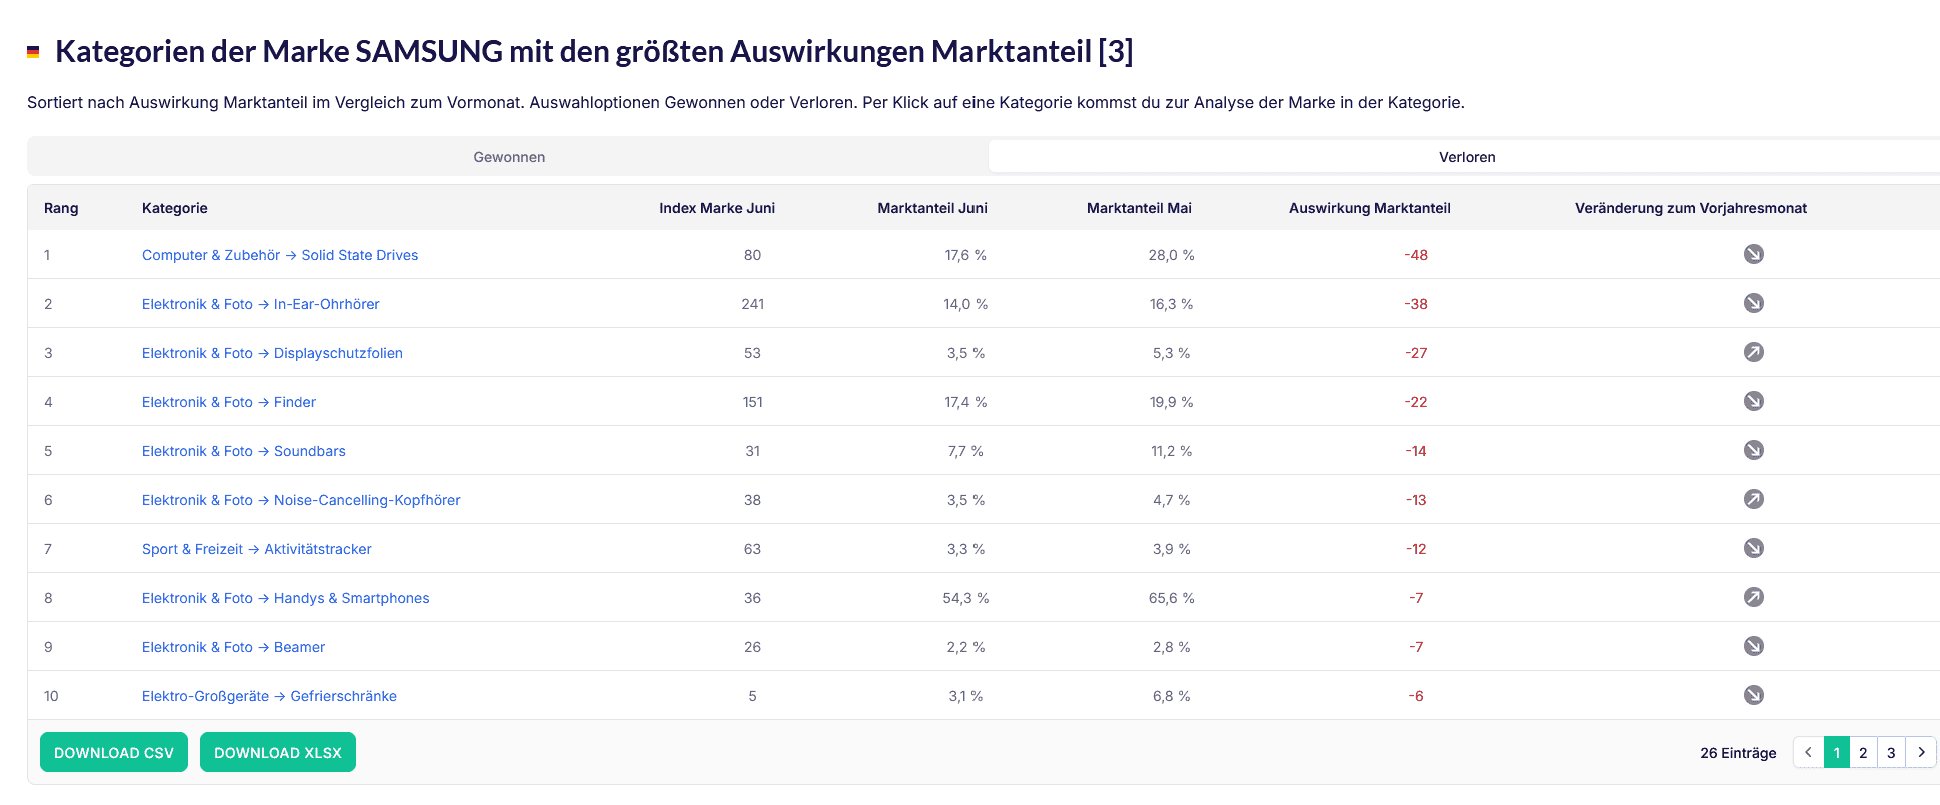
- Wähle oben in Tabelle (3) "Verloren" aus.
- Verlierer-Kategorien sind Kategorien, in denen die Marke im Vergleich zum Vormonat Anteile verloren hat und sich die Kategorie besser entwickelt hat als die Marke.
- Ein Klick auf eine Kategorie führt zur Analyse der Marken-Anteile in der ausgewählten Kategorie.
Beispiel-Interpretation:
- Für dieses Beispiel wird die Verlierer-Kategorie mit dem größten Verlust ausgewählt: Solid State Drives (Marktanteil von 28,0 % auf 17,6 % gefallen, –48 Punkte).
V. Entwicklung Marke in Kategorie
Ansatz:
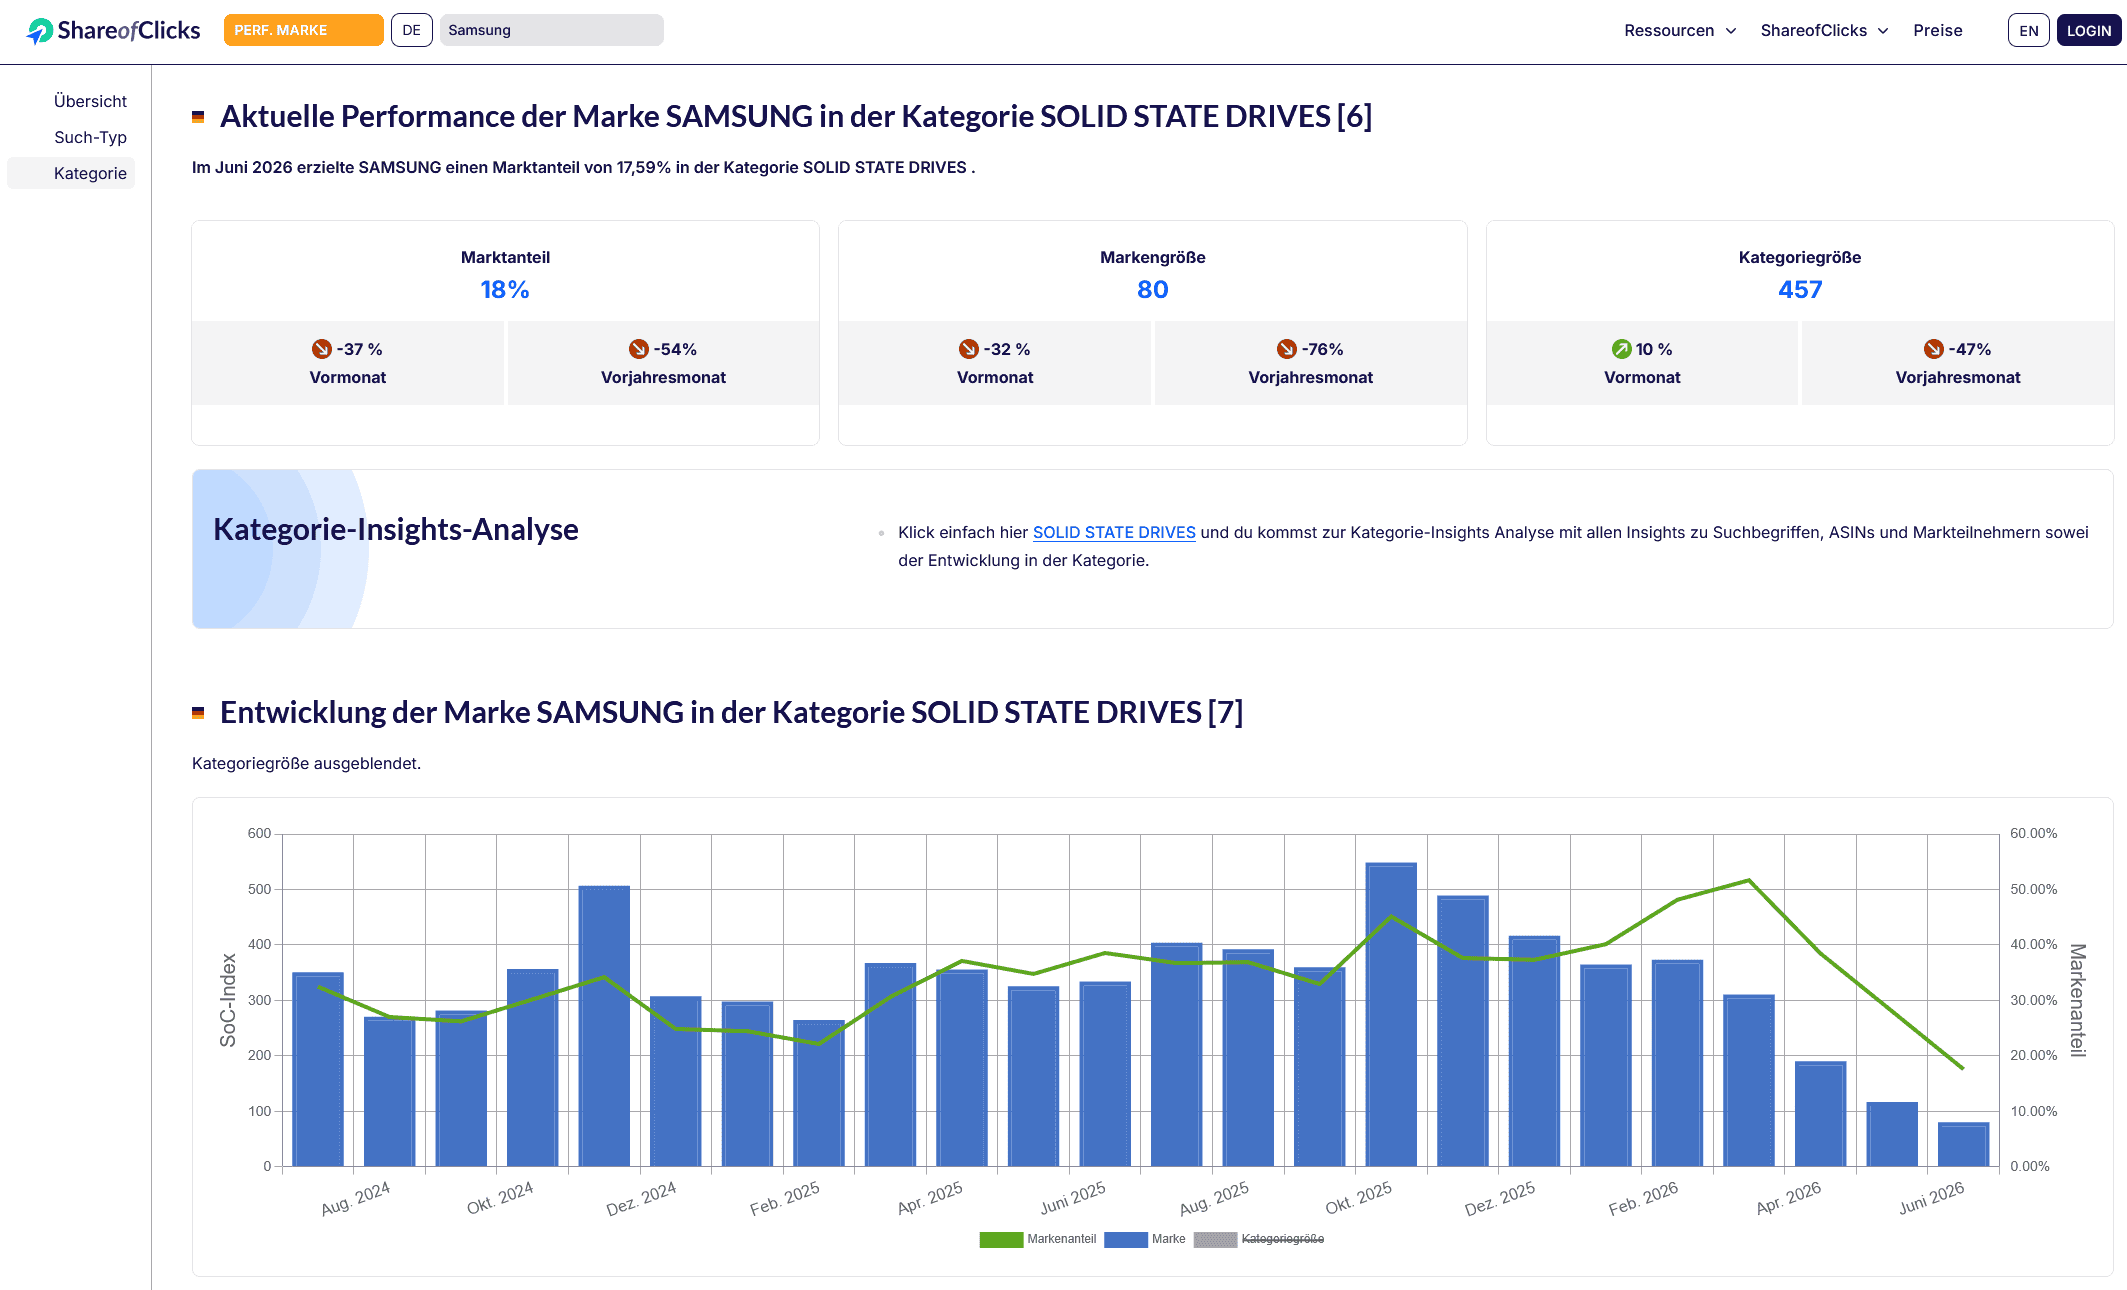
- „Marke in Kategorie“ (Tabelle 6) liefert vergleichbare Insights wie Tabelle (1), nur auf Kategorie-Ebene.
- Die „Entwicklung der Kategorie“ kann in Tabelle (7) über die Legende hinzugefügt werden.
- Ein Klick auf den Kategorienamen in der Info-Box führt zur Kategorie-Insight-Analyse.
Beispiel-Interpretation:
- Im Juni 2026 erzielte Samsung in der Kategorie Solid State Drives einen Marktanteil von 17,59 % (–37 % zum Vormonat, –54 % zum Vorjahresmonat).
VI. Übersicht Kategorie
Ansatz:
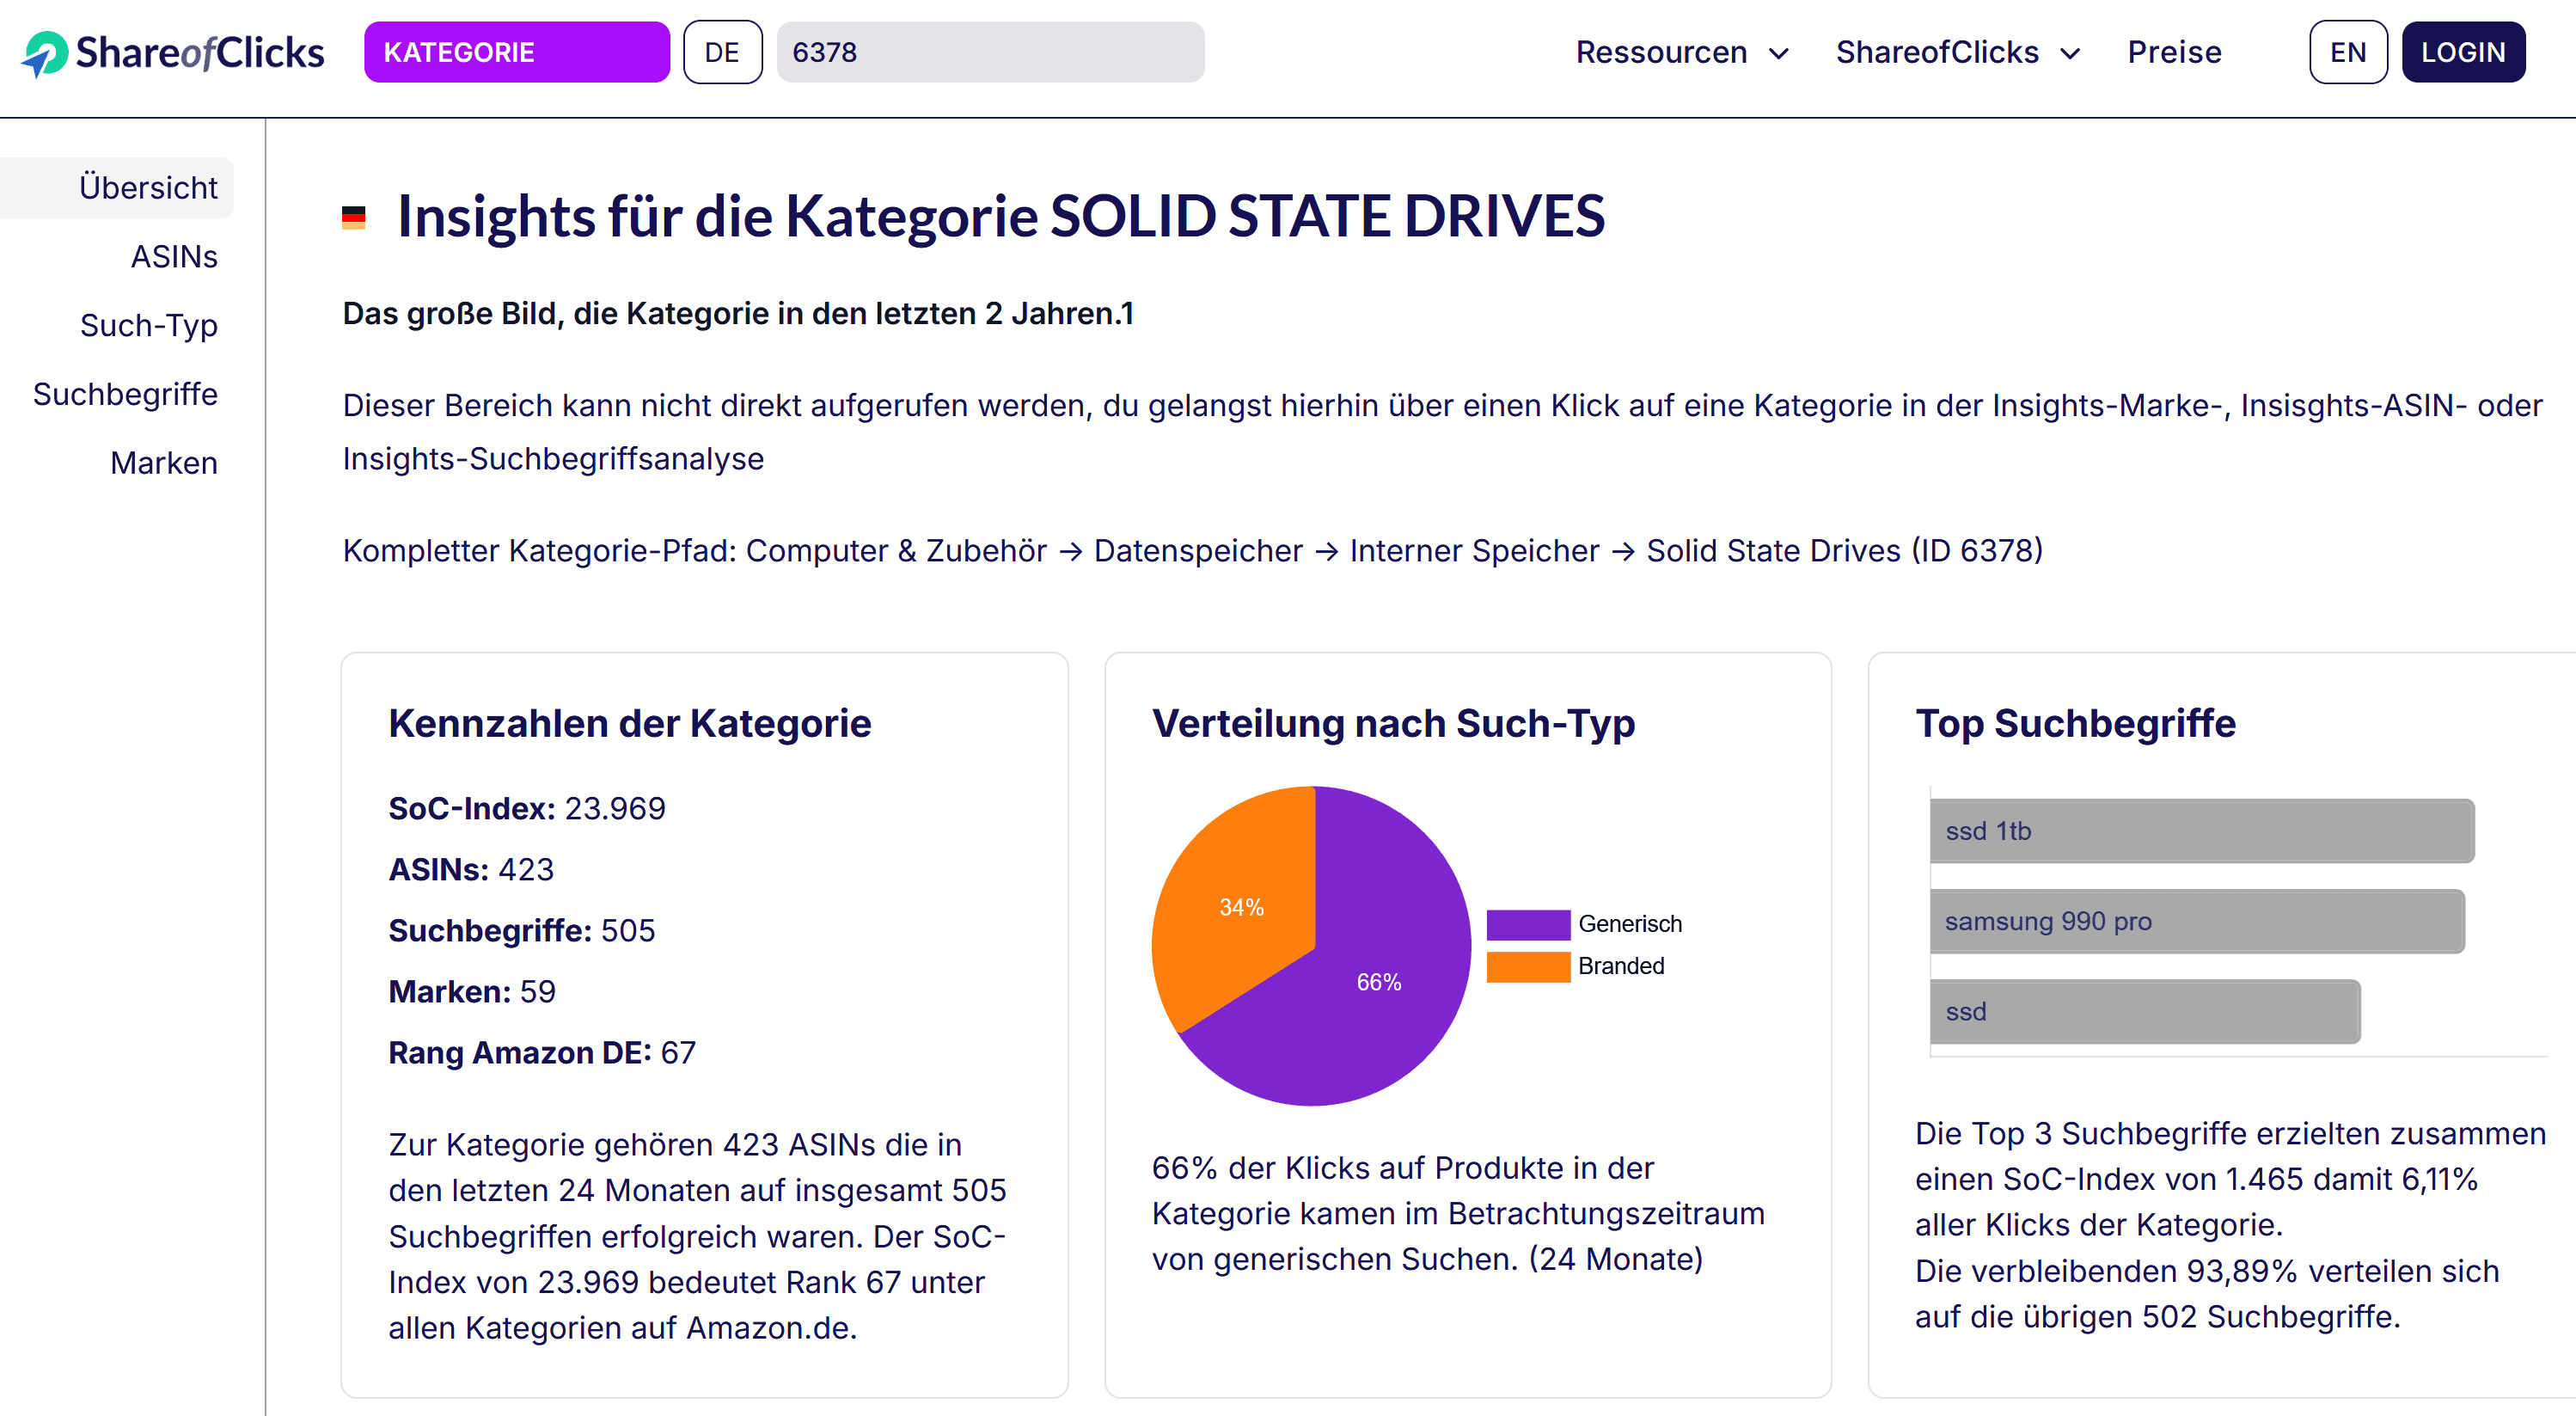
- Kategorien können nicht direkt aufgerufen werden, sondern nur über den Umweg von Kategorie-Links bei Marken, ASINs oder Suchbegriffen.
- Das Kreisdiagramm zeigt die Verteilung der Klicks nach Such-Typ.
- Um die Treiber der Entwicklung in der Kategorie besser zu verstehen, klicke oben links auf "Marken".
Beispiel-Interpretation:
- Kennzahlen der Kategorie Solid State Drives (ID 6378): SoC-Index 23.969, 423 ASINs, 505 Suchbegriffe, 59 Marken, Rang 67 auf Amazon.de. Verteilung nach Such-Typ: 66 % generisch, 34 % Branded.
VII. Entwicklung Marken in der Kategorie
Ansatz:
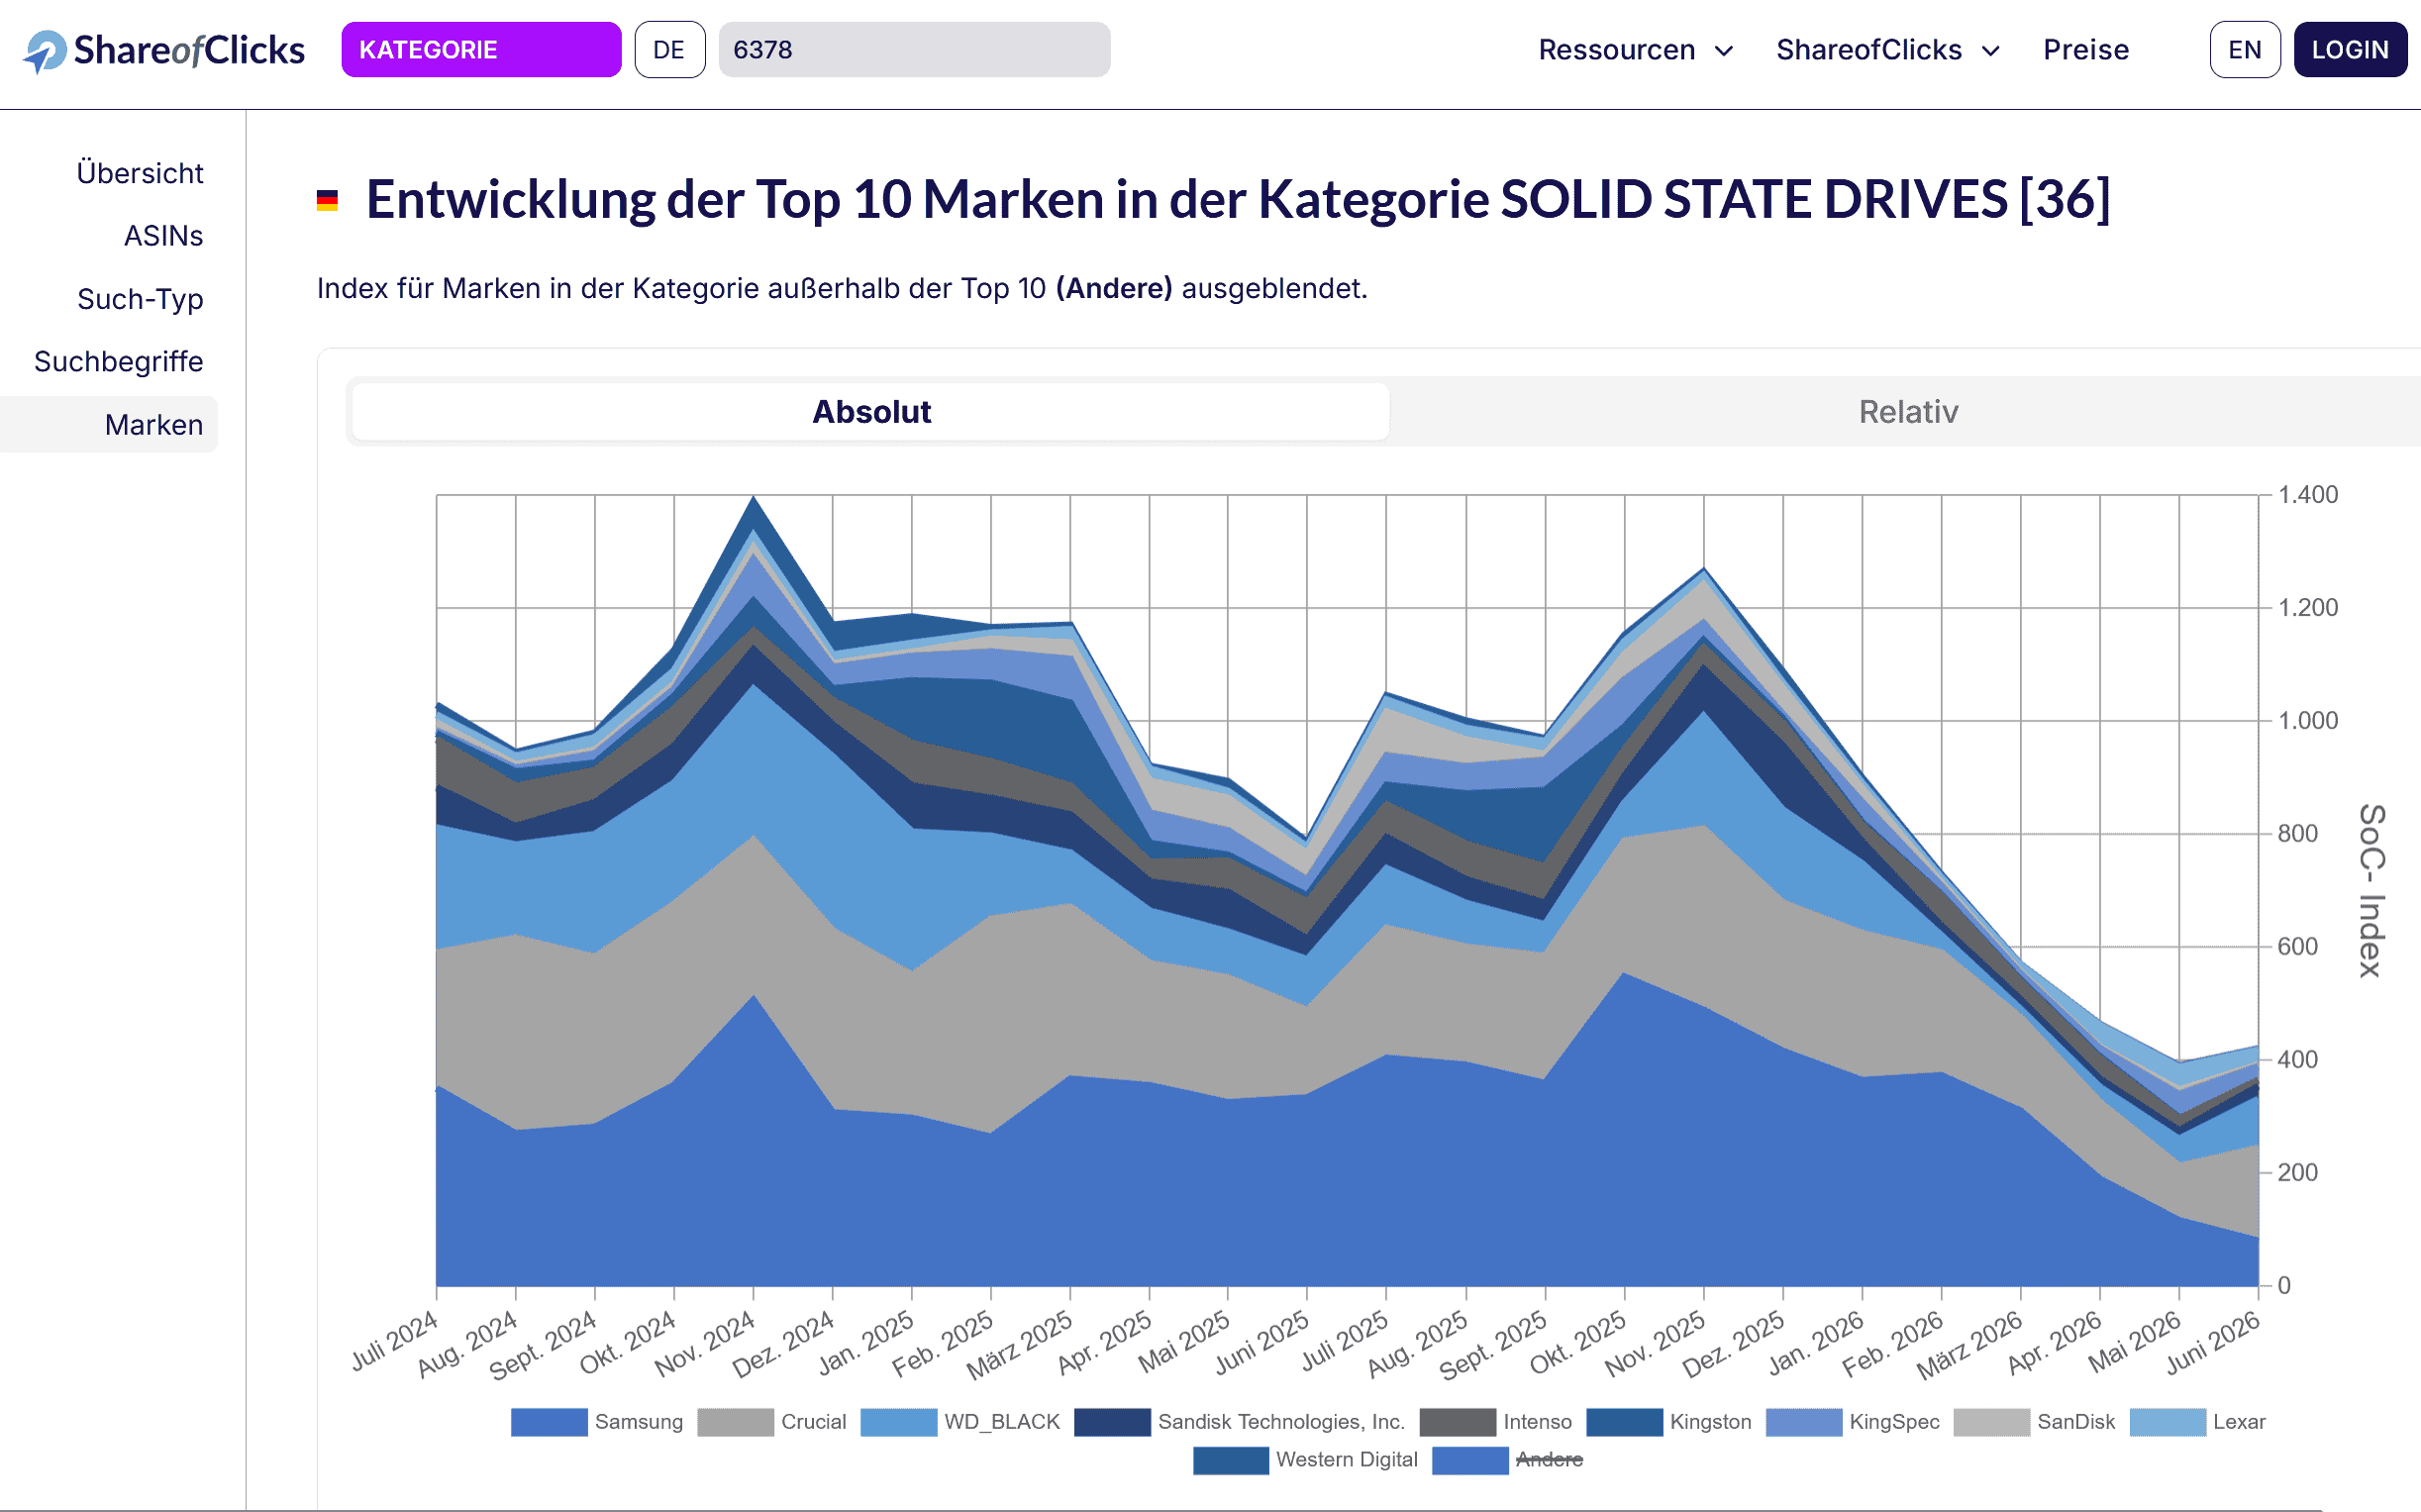
- Der Chart zeigt die Entwicklung der Top-10-Marken in der Kategorie über die letzten 2 Jahre und hilft zu erkennen, ob ein Rückgang der Kategorie eher durch die eigene Marke oder durch andere Marken verursacht wurde.
- Um die Entwicklung bei den ASINs in der Kategorie besser zu verstehen, klicke oben links auf "ASIN".
Beispiel-Interpretation:
- Der Rückgang der Kategorie wurde größtenteils durch den Rückgang bei Samsung verursacht.
- Der Index der anderen Marken (Crucial, WD_BLACK, Sandisk Technologies, Intenso, Kingston, KingSpec, SanDisk, Lexar, Western Digital) blieb relativ stabil.
VIII. Entwicklung ASINs in der Kategorie
Ansatz:
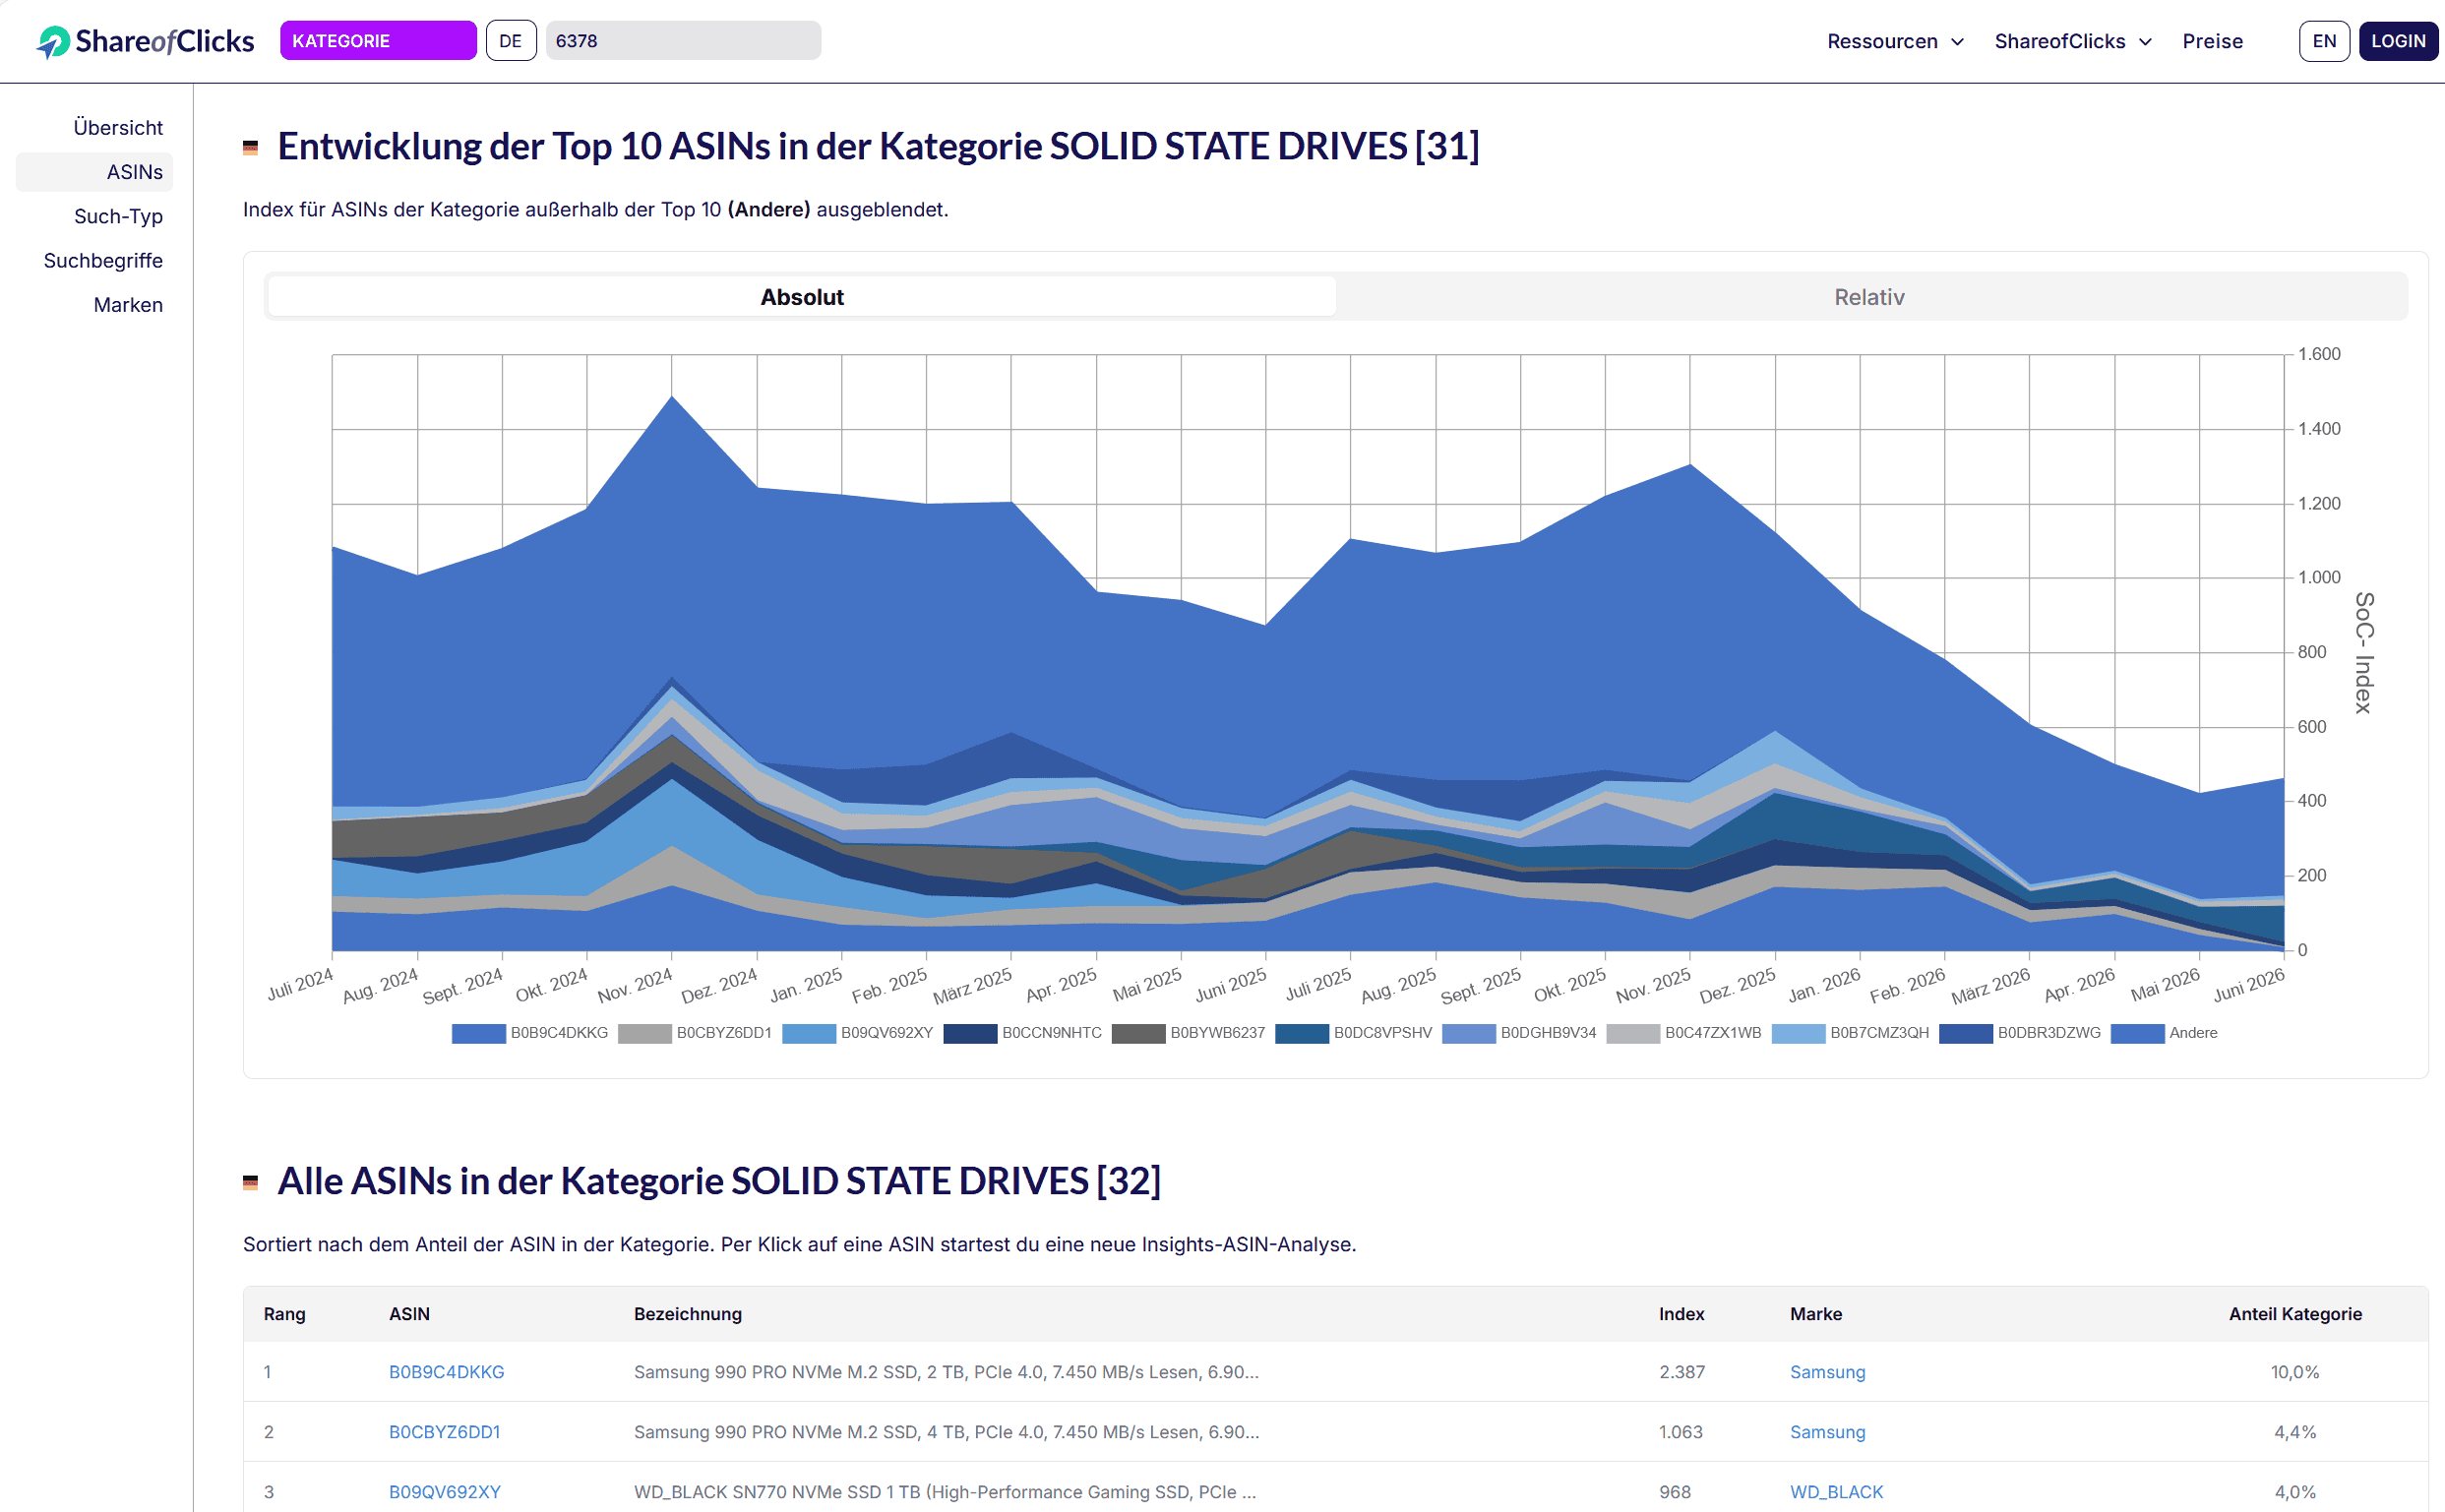
- Klicke in der Legende auf "Andere", um den Index aller ASINs in der Kategorie zu betrachten.
- Ein Klick auf eine ASIN führt zur ASIN-Insights-Analyse.
Beispiel-Interpretation:
- Die zwei erfolgreichsten ASINs von Samsung der letzten 2 Jahre haben in den letzten Monaten signifikant Klickanteile verloren: B0B9C4DKKG (Samsung 990 PRO 2 TB, 10,0 % Kategorieanteil) und B0CBYZ6DD1 (Samsung 990 PRO 4 TB, 4,4 % Kategorieanteil).
- Für die weitere Analyse wird B0B9C4DKKG ausgewählt.
IX. Übersicht ASIN
Ansatz:
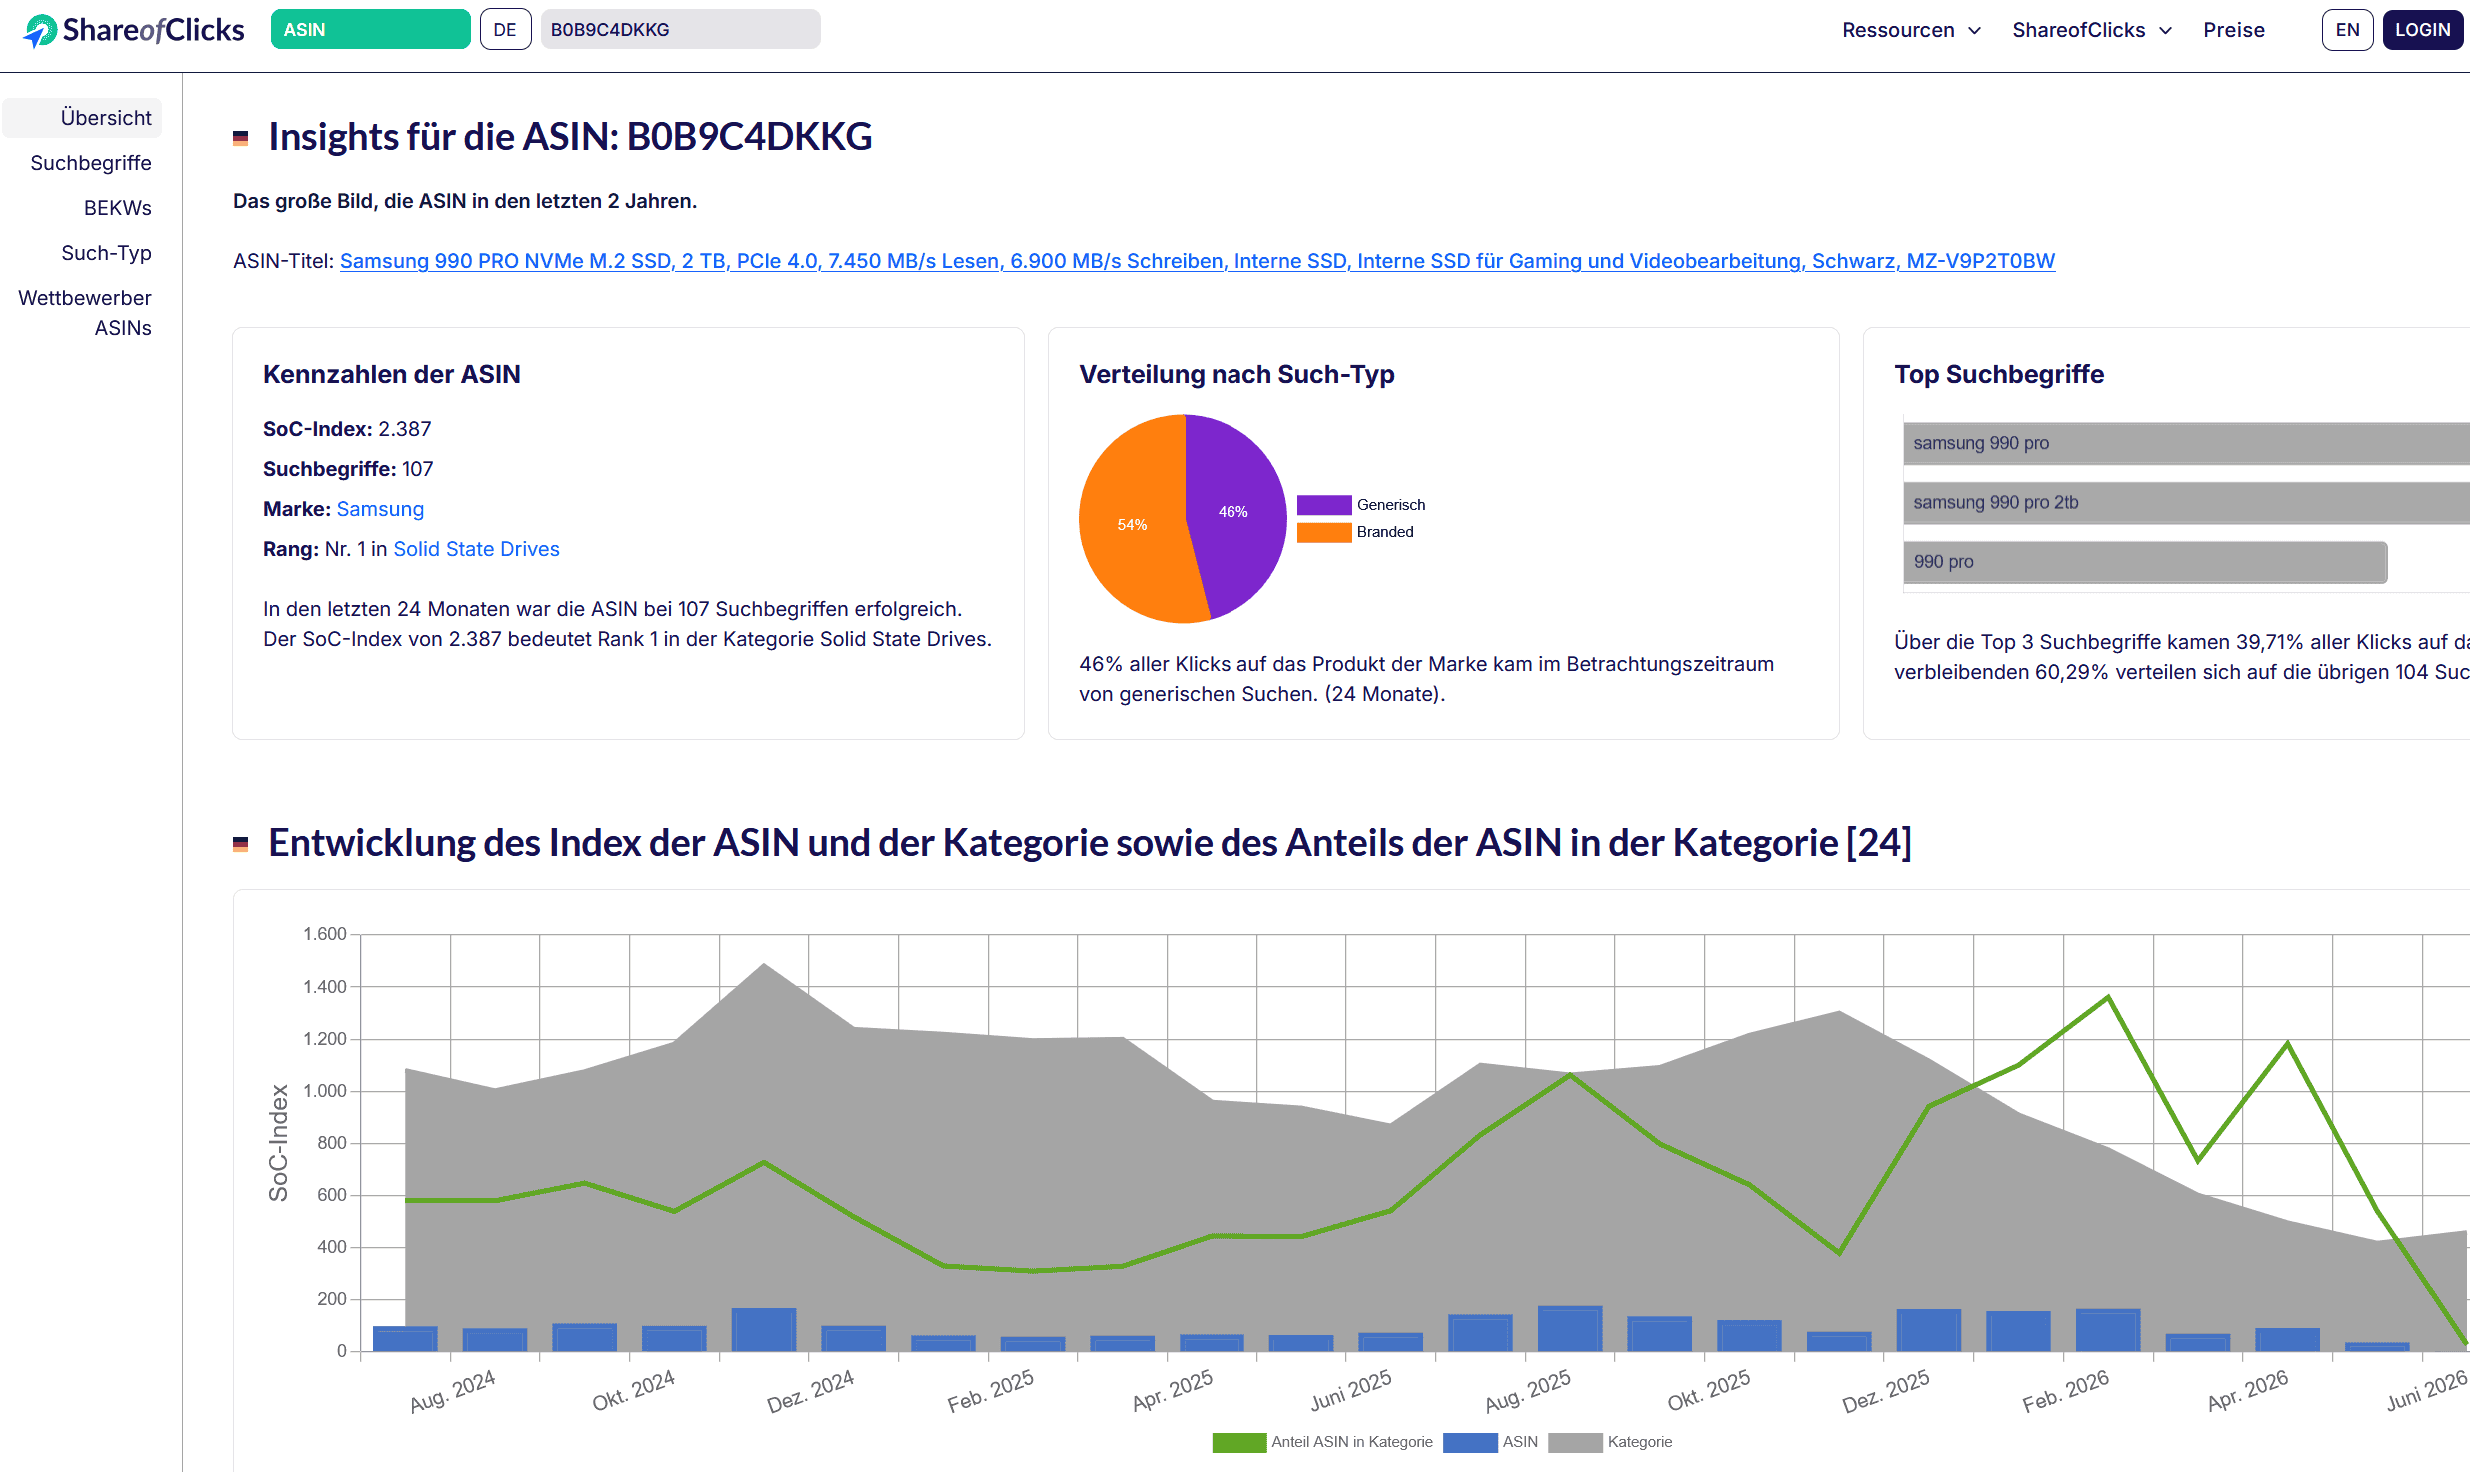
- Tabelle mit dem ASIN-Trend der letzten 2 Jahre und dem Anteil der ASIN in der Kategorie.
- Ein Klick oben rechts führt zur Such-Typ-Analyse.
Beispiel-Interpretation:
- Ausgewählte ASIN B0B9C4DKKG, Samsung 990 PRO NVMe M.2 SSD, 2 TB
- SoC-Index 2.387, 107 Suchbegriffe, Rang Nr. 1 in Solid State Drives, 54 % Branded / 46 % generische Klicks.
X. ASIN nach Such-Typ
Ansatz:
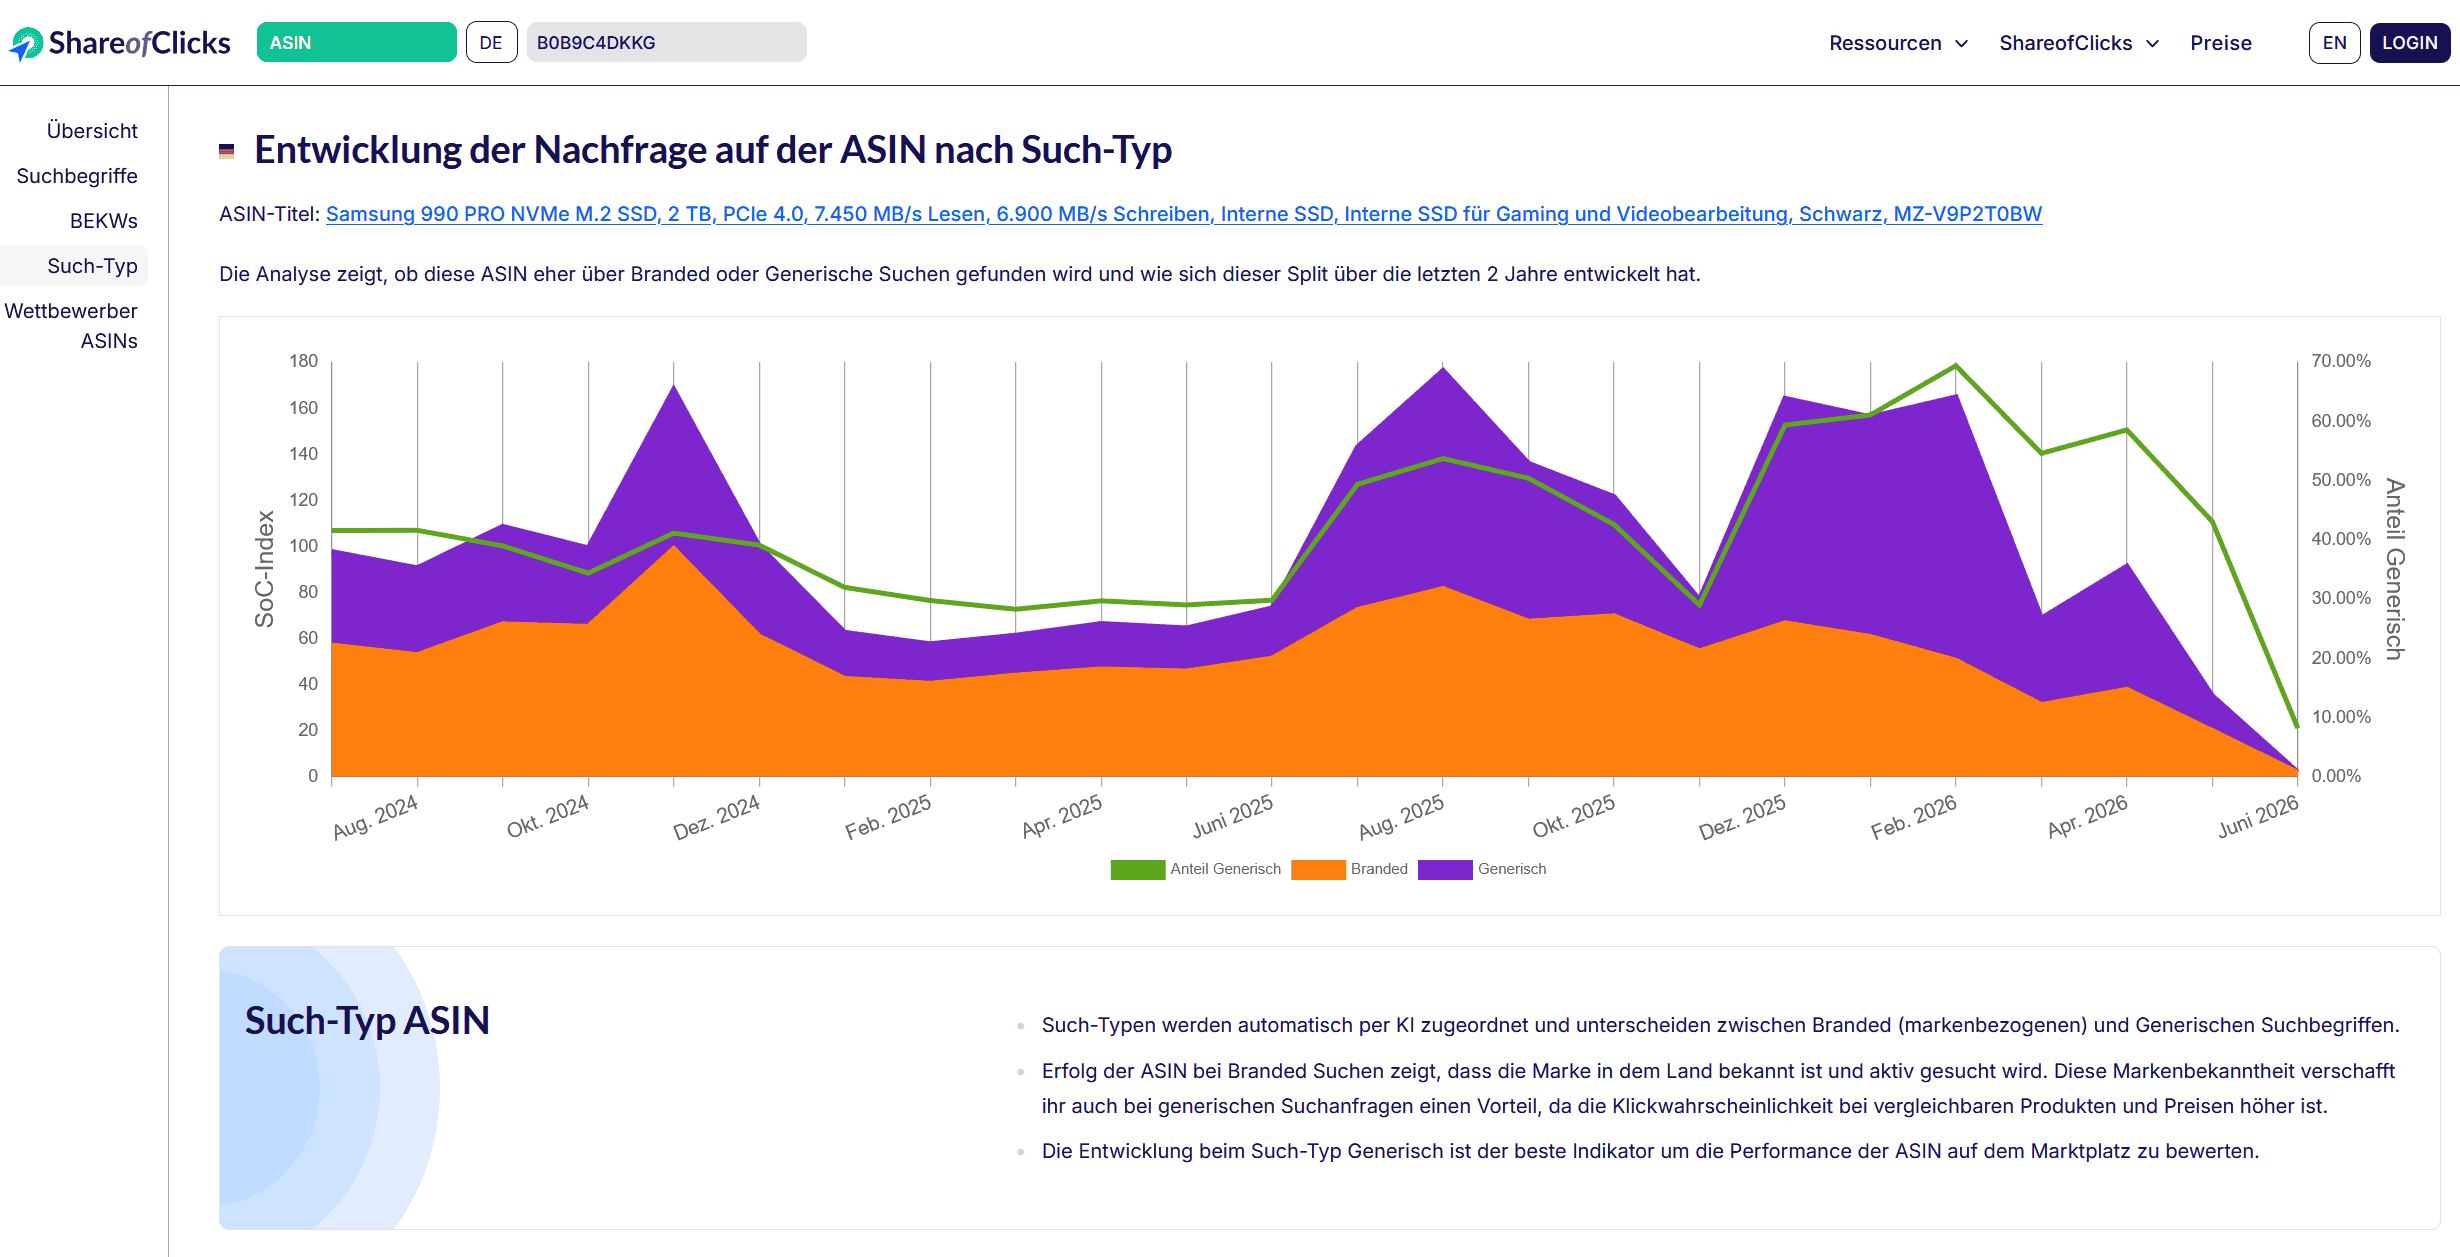
- Die Such-Typ-Analyse zeigt, ob sich die Nachfrage nach der ASIN je Such-Typ unterschiedlich entwickelt hat.
- Ein schlechterer Trend bei generischer Suche spricht für Probleme bei der generischen Sichtbarkeit.
Beispiel-Interpretation:
- Der Anteil generischer Klicks (grüne Linie) ist zuletzt deutlich gefallen – ein Hinweis auf nachlassende generische Sichtbarkeit dieser ASIN.
Marken-Analysen im Amazon Performance Tracker sind immer nur für eine Marke gleichzeitig möglich. Auf Anfrage können wir Analysen auch für mehrere Marken durchführen und die Rohdaten für die interne Verwendung zur Verfügung stellen.
Bitte kontaktiere uns direkt.
Step-by-Step-Guide Beispiel 2
2. Welche Suchbegriffe sollten in den ASIN Content?
I. Auswahl und Eingabe auf Landing Page
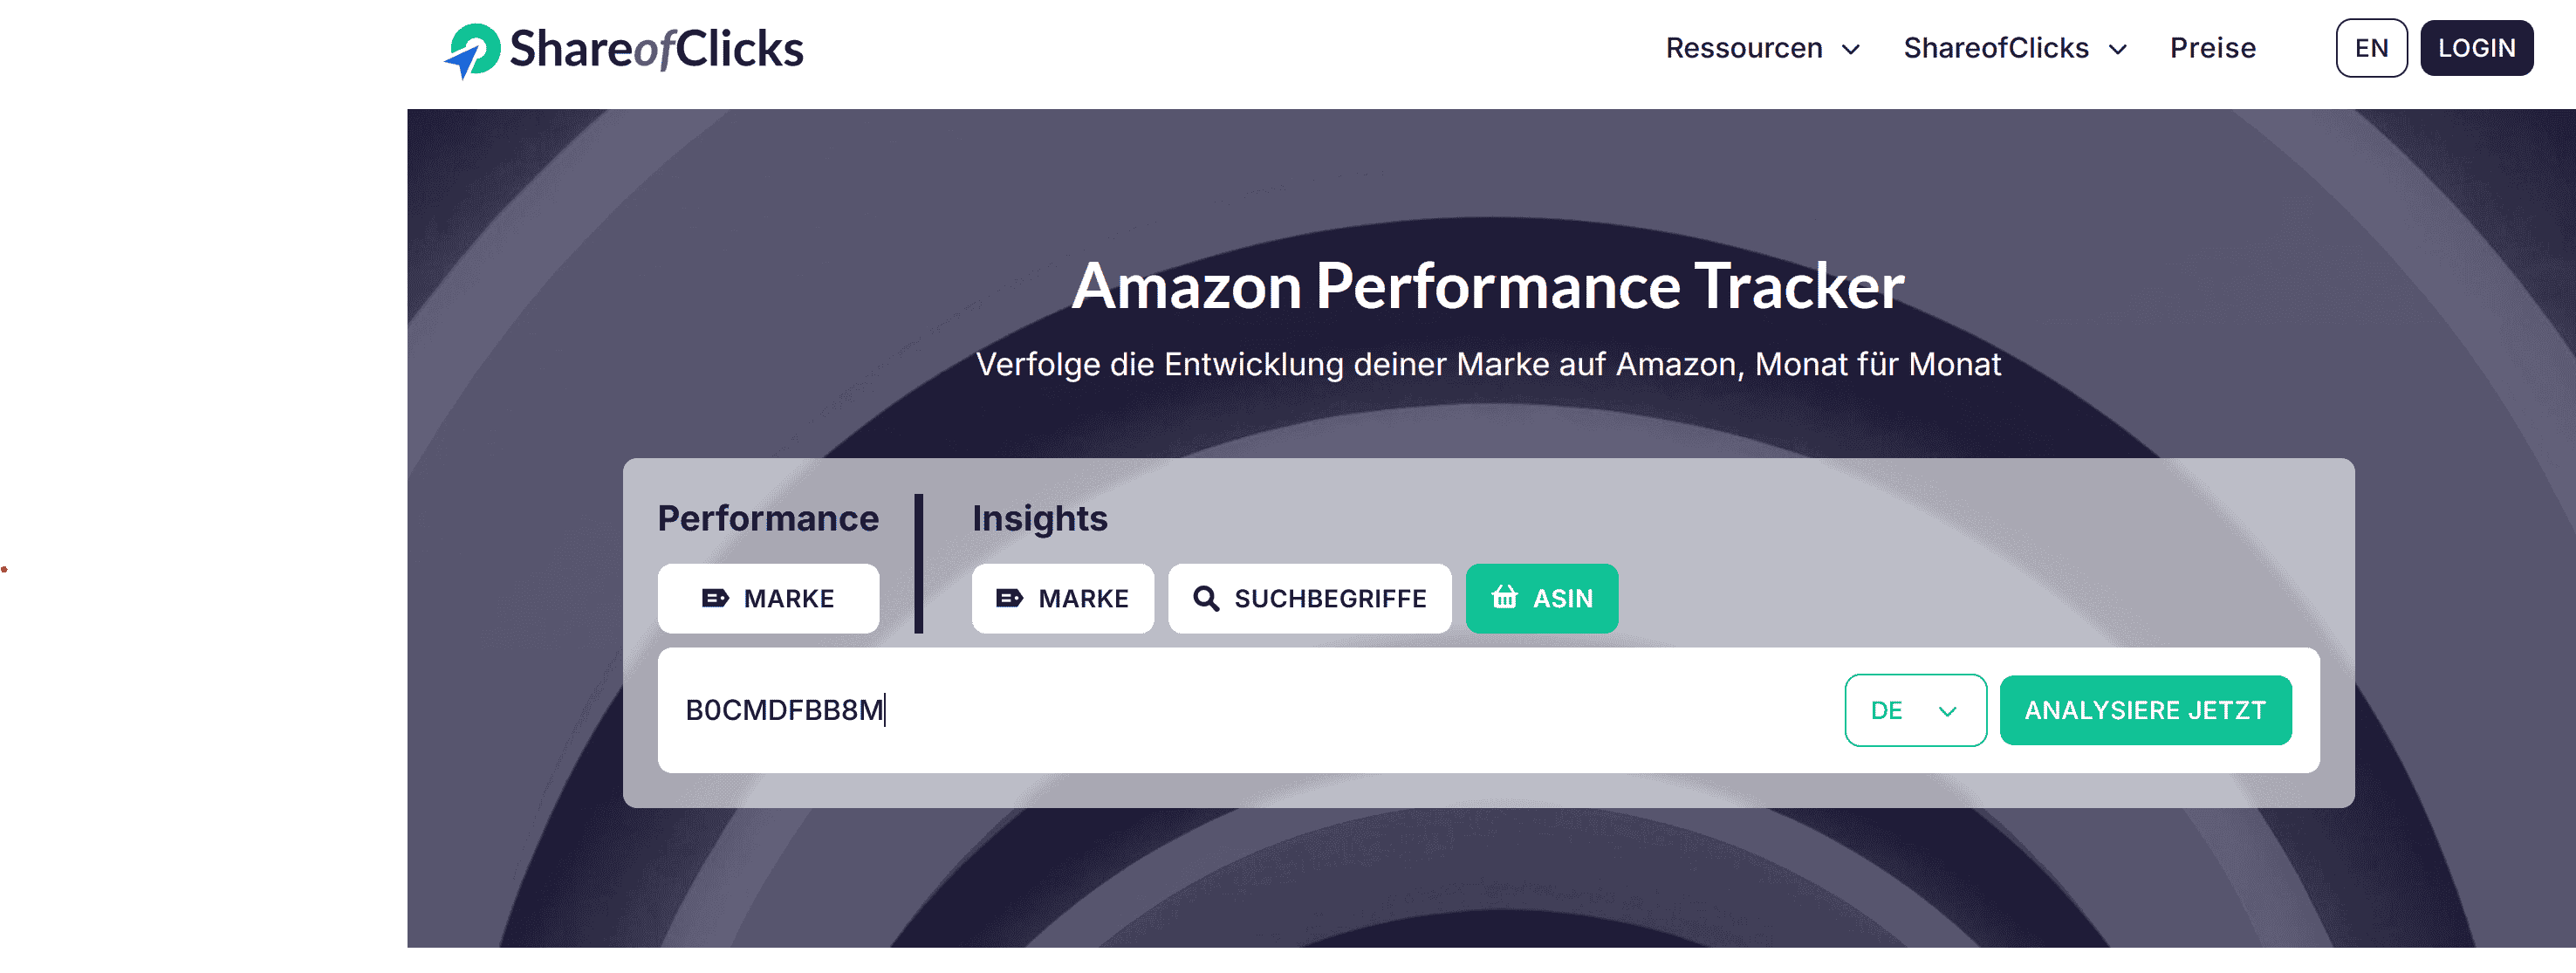
- Klick auf ASIN Insight Button
- Wähle Marktplatz (Beispiel DE) aus
- Gebe gewünschte ASIN (Beispiel B0CMDFBB8M)
- Klicke auf Analysiere jetzt
- Alternativ kann man auch auf eine ASIN in den verschiedenen Tabellen klicken
II. Übersicht ASIN
Ansatz:
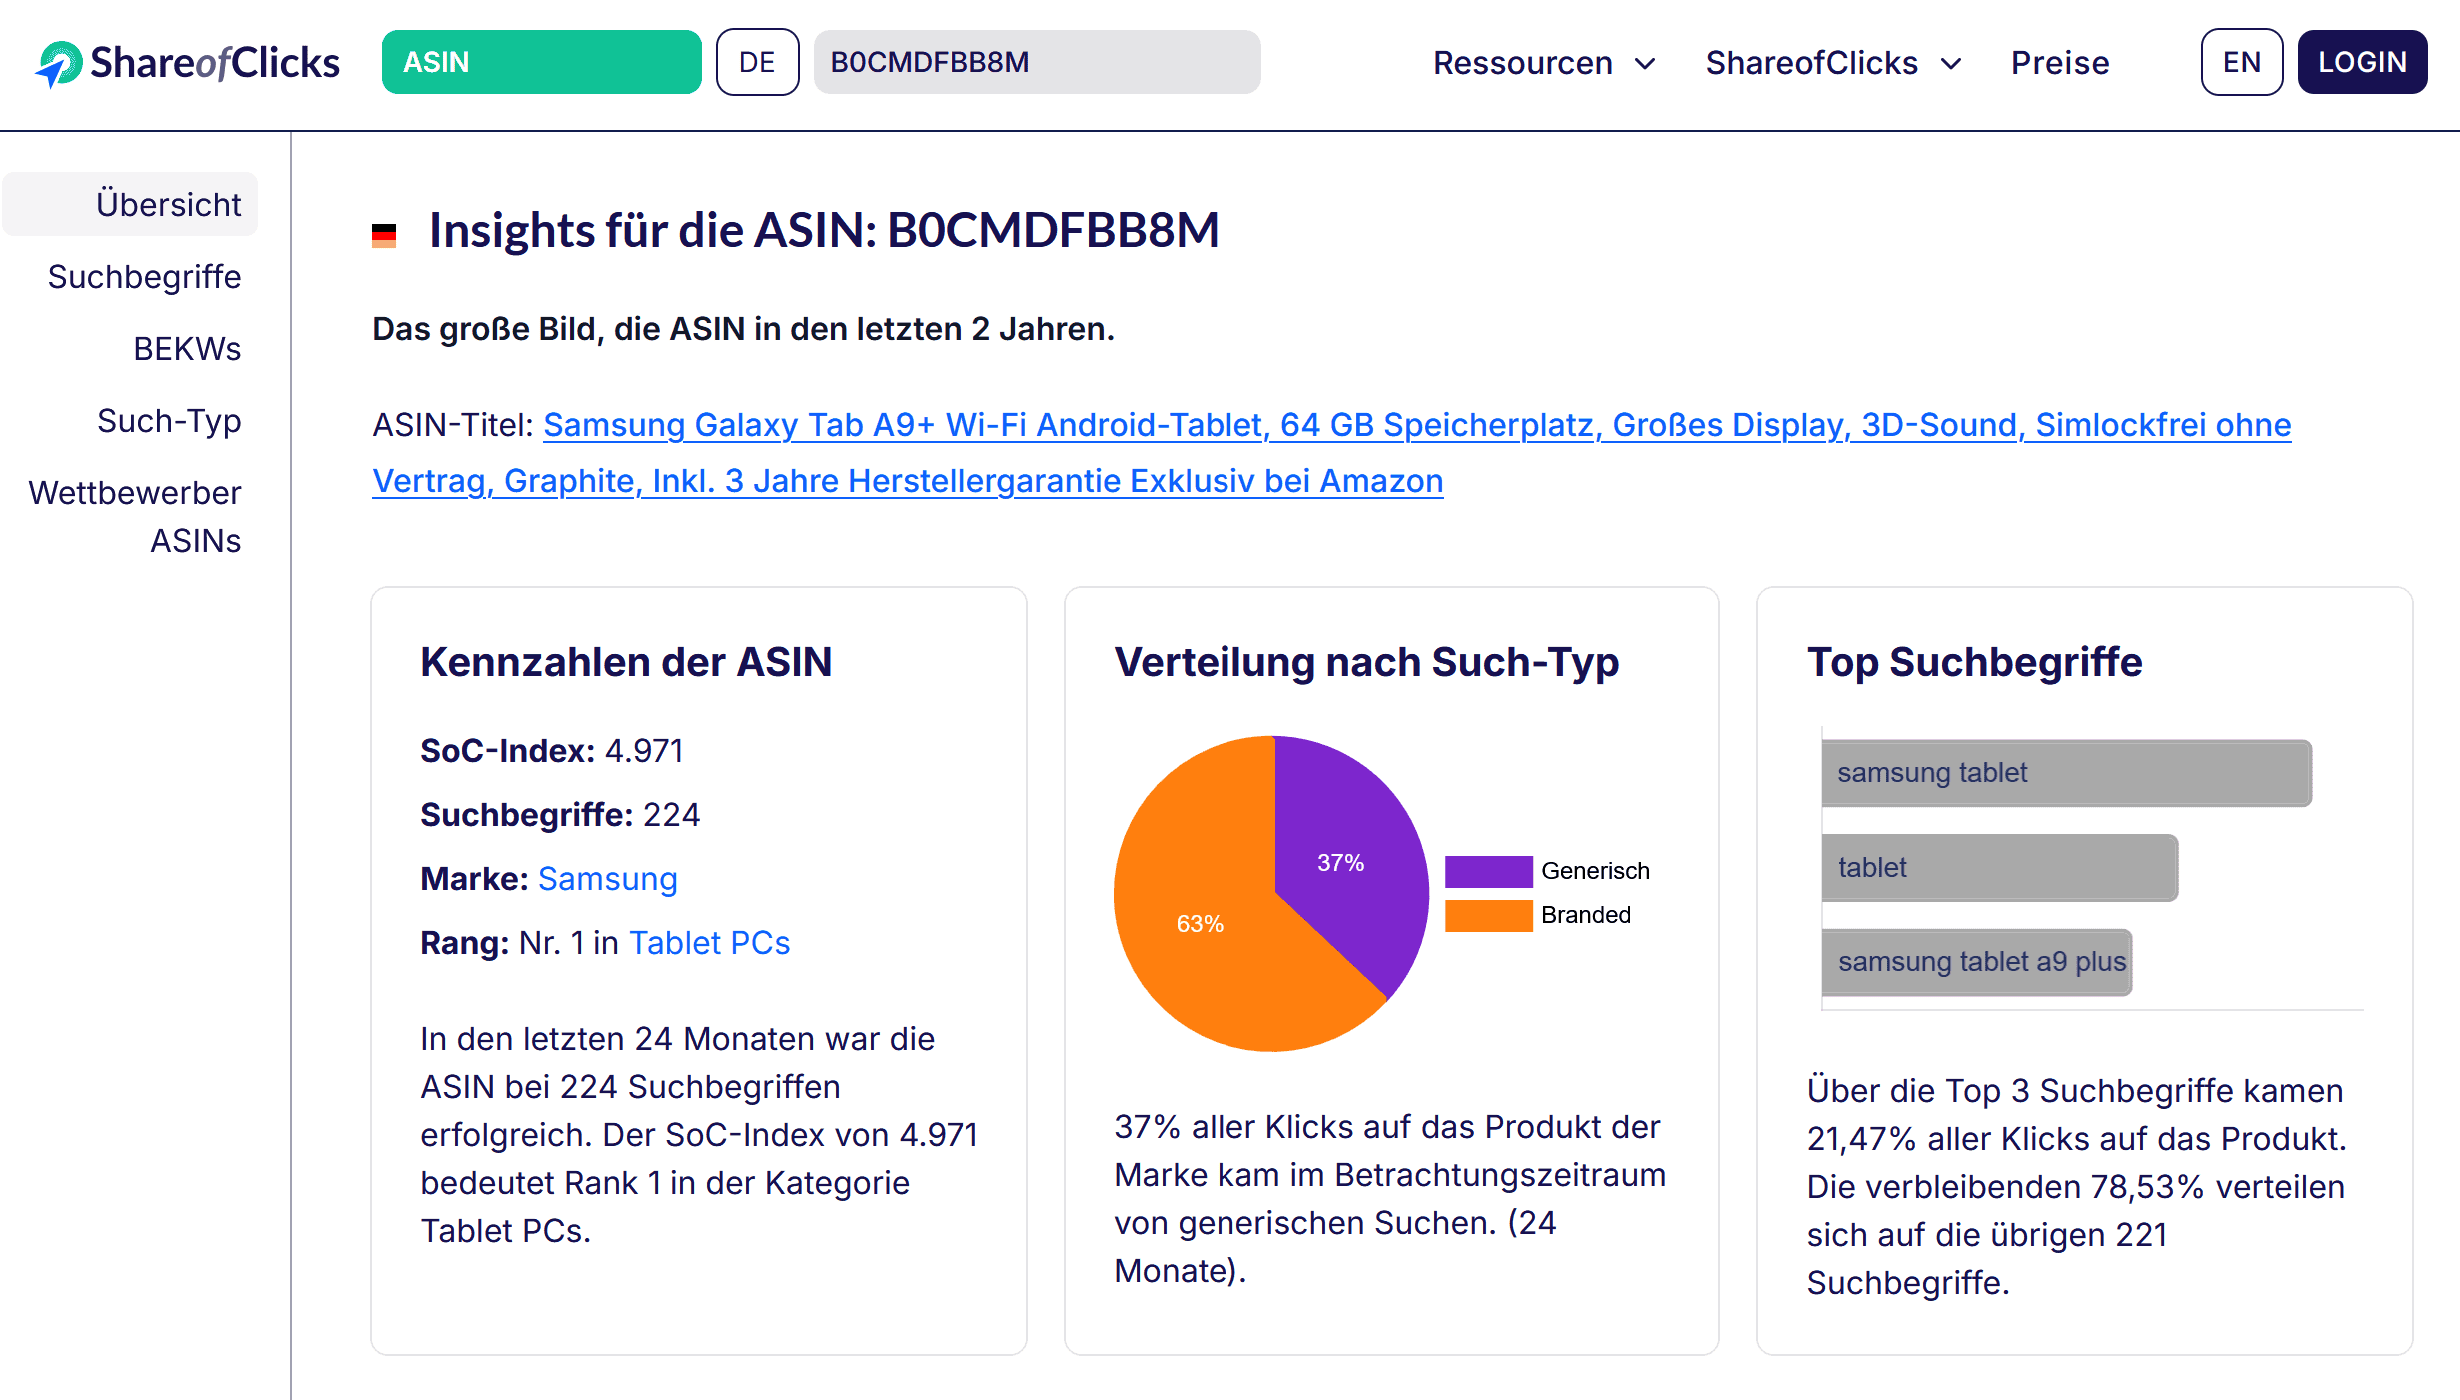
- Übersicht über die Entwicklung der ASIN in den letzten 2 Jahren, inklusive Rang in der Kategorie und Verteilung nach Such-Typ.
- Ein Klick auf "BEKWs" führt zur Übersicht der ASIN-spezifischen Keywörter.
Beispiel-Interpretation:
- Analysierte ASIN: B0CMDFBB8M, Samsung Galaxy Tab A9+
- SoC-Index 4.971, 224 Suchbegriffe, Rang Nr. 1 in Tablet PCs, 63 % Branded / 37 % generische Klicks.
III Keywörter für ASIN
Ansatz:
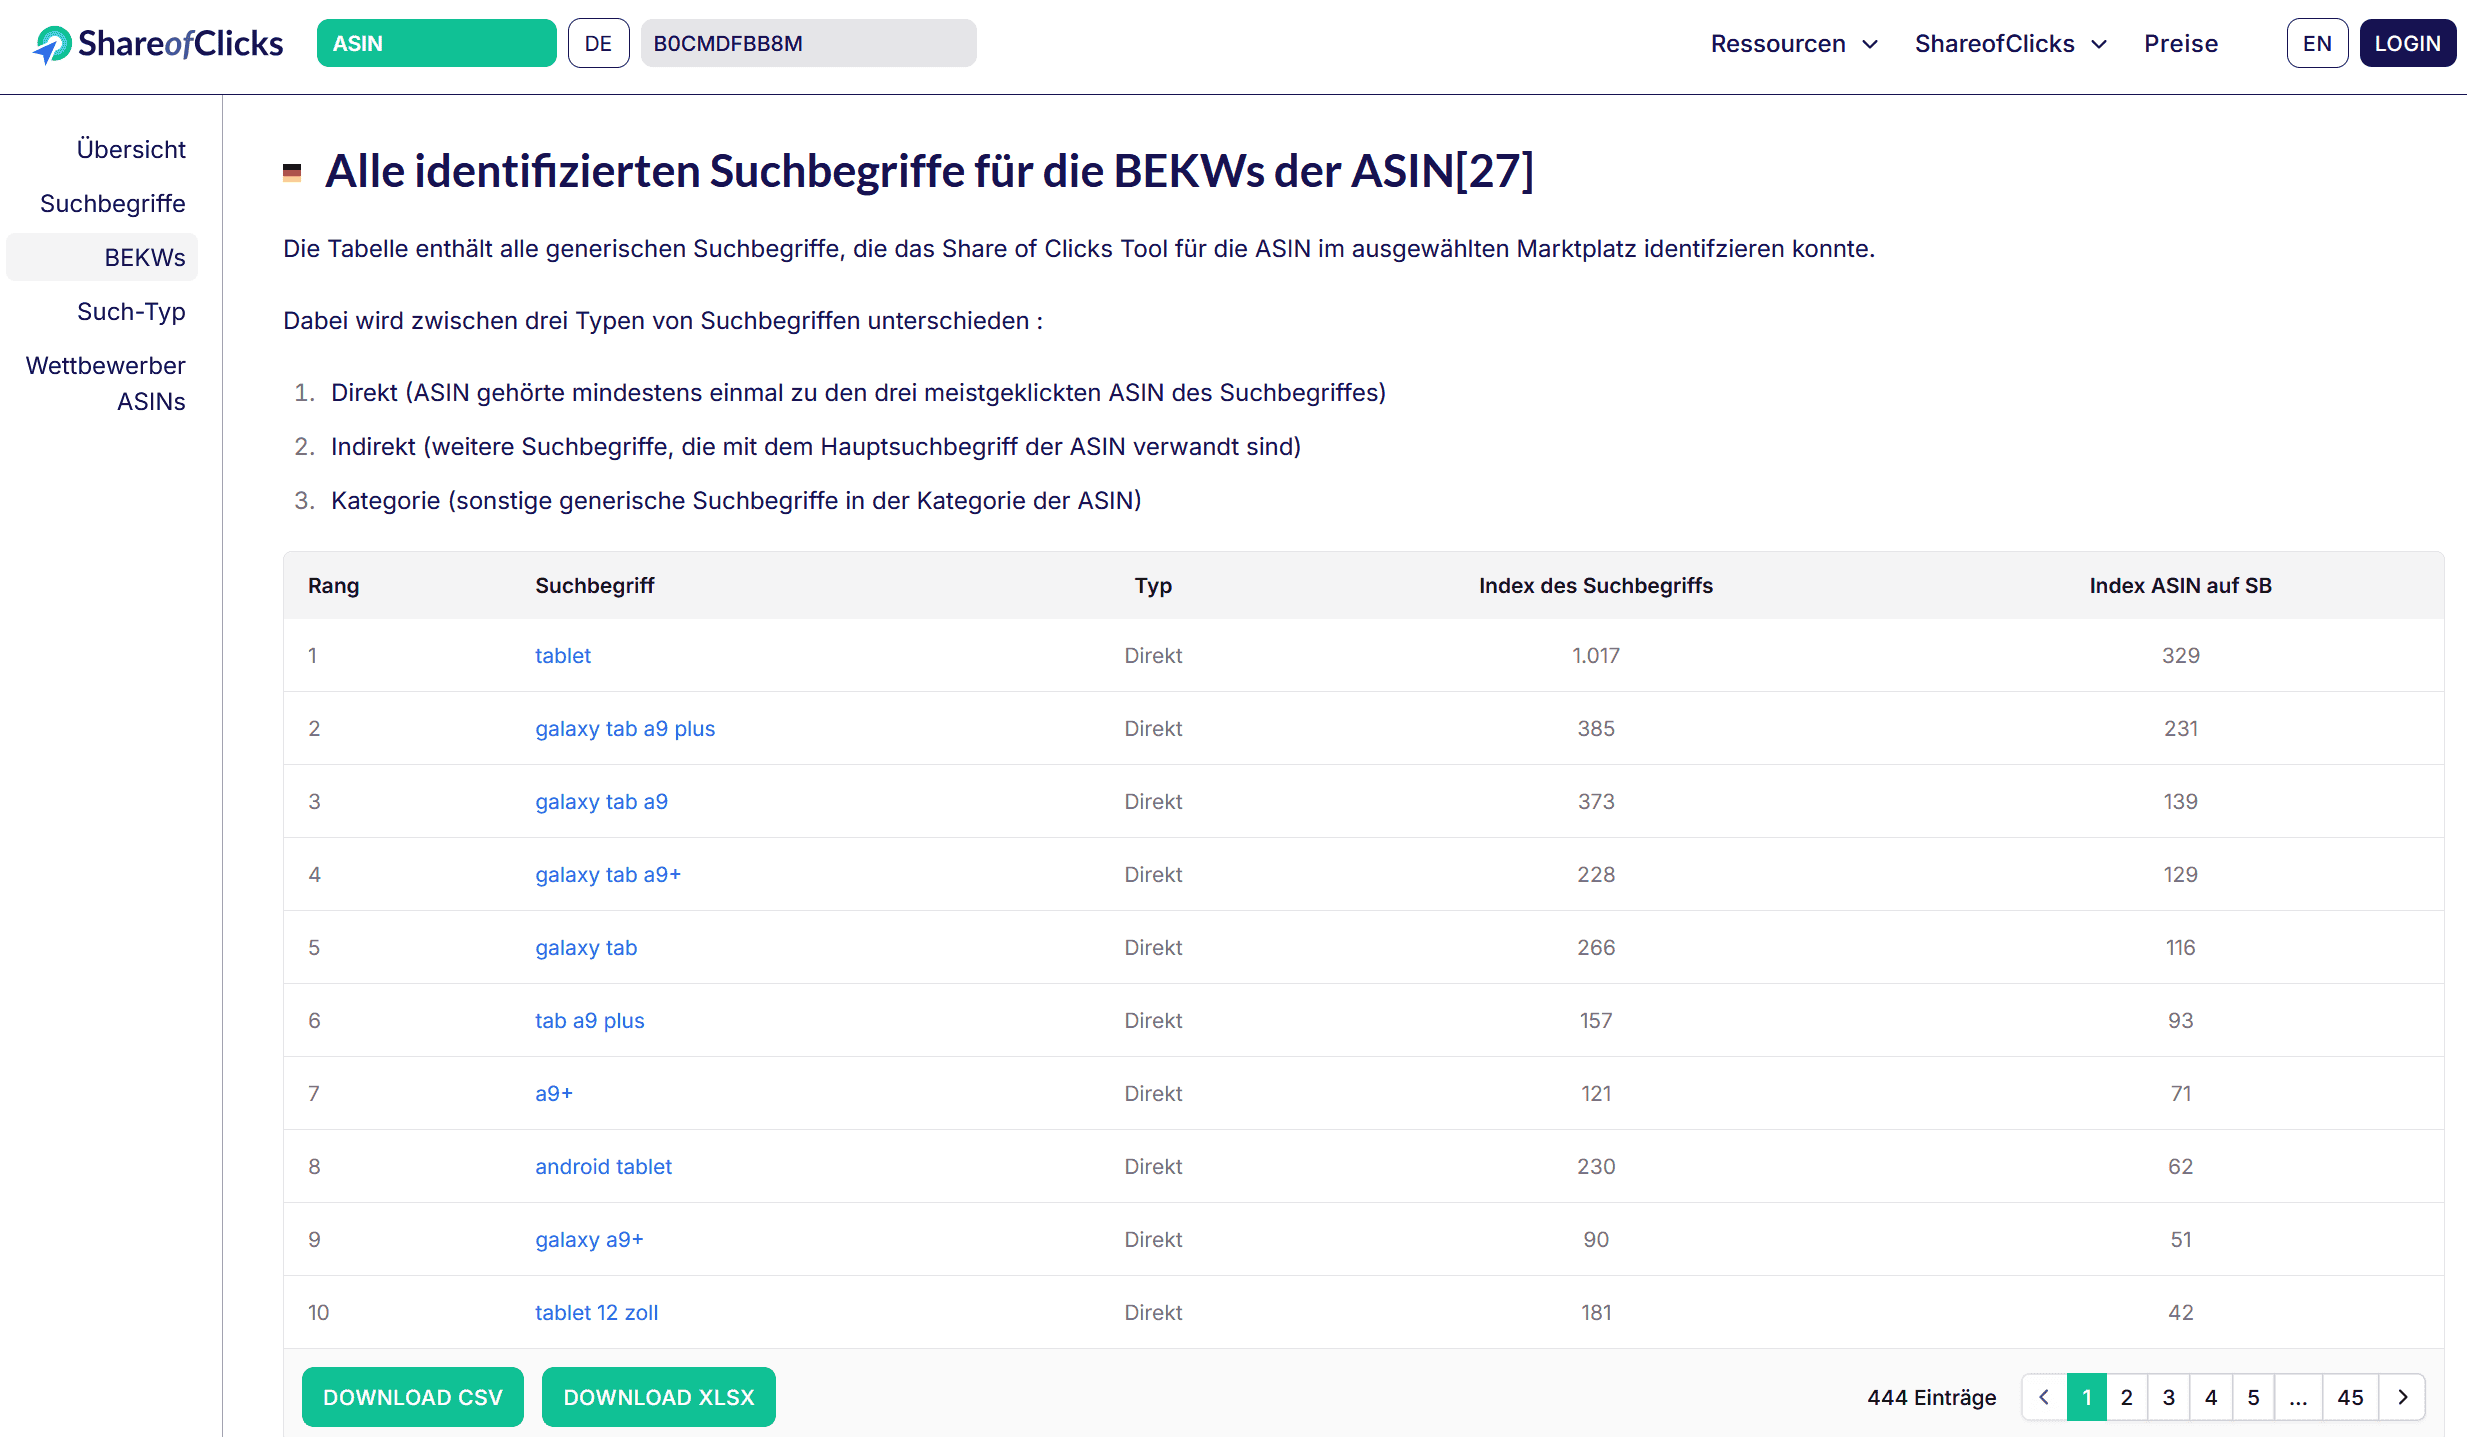
- Die Liste enthält alle Suchbegriffe, die das SoC-Tool für die ASIN identifiziert hat – jeweils mit Rang, Typ (Direkt/Indirekt/Kategorie), Index des Suchbegriffs und Index der ASIN auf den Suchbegriff.
- Die Top-10-Suchbegriffe sind für alle sichtbar. Für Suchbegriffe außerhalb der Top 10 sowie für die Download-Möglichkeit (CSV/XLSX) ist mindestens das Paket „Advanced“ erforderlich.
- Lade die Liste herunter (Paket "Advanced" erforderlich) und wähle daraus die für den ASIN-Content relevanten Suchbegriffe aus.
Beispiel-Interpretation:
- Analysierte ASIN: B0CMDFBB8M, Samsung Galaxy Tab A9+
- Top-Suchbegriffe: „tablet“, „galaxy tab a9 plus“, „galaxy tab a9“.
Bei Bedarf können wir eine Zusammenfassung mit allen Keywörtern für eine Vielzahl von ASINs auf verschiedenen Marktplätzen als Download zur internen Verwendung zur Verfügung stellen.
Bitte kontaktiere uns direkt.
Step-by-Step-Guide Beispiel 3
3. Auf welchen generischen Suchbegriffe sollte ich jetzt Werbung schalten?
I. Auswahl und Eingabe auf Landing Page
- Klick auf Performance Marke Button
- Wähle Marktplatz (Beispiel DE) aus
- Gebe gewünschte Marke ein (Beispiel Samsung)
- Klicke auf Analysiere jetzt
II. Übersichtsseite Performance Marke
Ansatz:
- Scrolle auf der Übersichtsseite nach unten bis zu Tabelle (4).
III. Review Suchbegriffe mit großen Veränderungen
Ansatz:
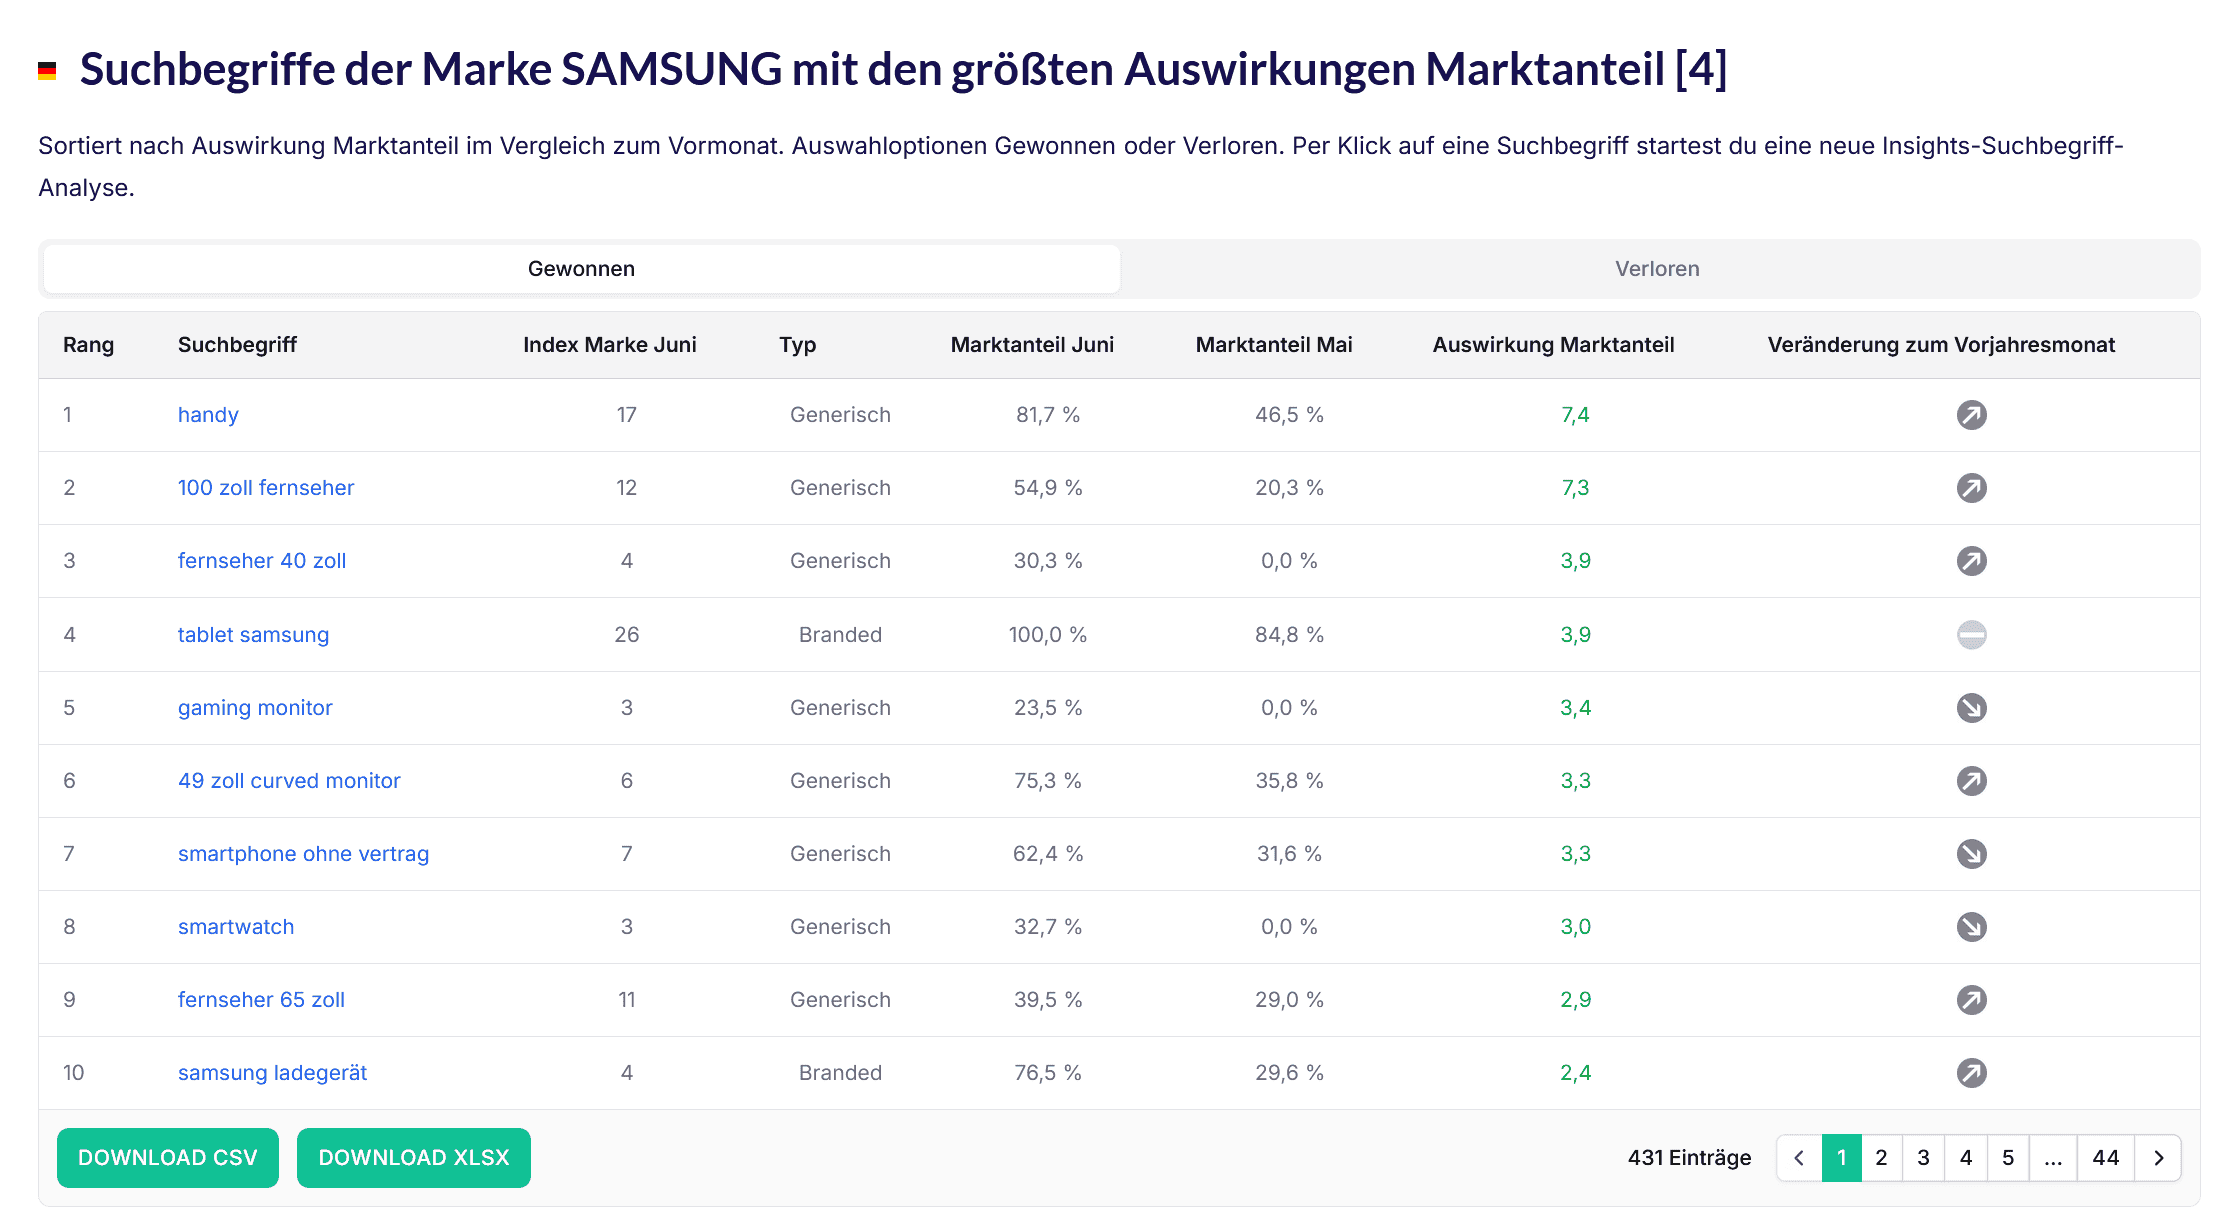
- Tabelle (4) liefert Informationen zu allen Suchbegriffen, auf denen die ASINs der Marke in den letzten 2 Jahren erfolgreich waren, sowie zum Anteil der Marke an diesen Suchbegriffen im aktuellen Monat und im Vormonat.
- Lade die CSV herunter (Paket "Advanced" erforderlich) und analysiere, auf welchen Suchbegriffen Werbung zusätzliche Umsätze verspricht
Beispiel-Interpretation:
- Größter Zuwachs im Beispiel: „handy“ (Marktanteil von 46,5 % auf 81,7 %, +7,4 Punkte).
- Auf Anfrage stellen wir dir gerne ein Template zur Verfügung, mit dem du regelbasiert die Marken-Performance in AMS umsetzen kannst.
- Zusätzlich können wir dir die Suchbegriff-Daten für alle Marktplätze und für mehrere Marken in einem Datensatz zur internen Verwendung zur Verfügung stellen.
Bitte kontaktiere uns direkt.